

The technical analysis toolkit that has been applied to the stock market is also increasingly being used to trade crypto — albeit with some caveats. While the historical track record of stock price movements goes back centuries, the trading history of the crypto sector is still very new. For this reason, there is less data to look back at — and nascent industries like crypto tend to be more dynamic, volatile, and unpredictable than established markets. That being said, technical analysis can provide some insights that could help guide you in making prudent investing decisions.
Crypto Charting Patterns
Charting patterns are often used to anticipate future price movements. These charting patterns can often be used to make price predictions on a shorter time frame (days, hours, or even minutes), although some can also be leveraged to make more distant price forecasts. While fundamental analysis is typically used to forecast further into the future, combining fundamental and technical analyses that reach similar conclusions can help you have a higher degree of certainty about future price movements.
Lines and Wedges
Lines can often be drawn that connect the price peaks and price bottoms over a specified time frame. This tends to indicate that the price of an asset is reluctant to cross these lines, with the support line (the lower line) indicating a resistance to drop lower and the resistance line (the upper line) indicating a resistance to increase higher. While these lines can be horizontal, they typically trend either bearish (downward) or bullish (upward). This indicates a price that will gradually (or quickly) increase or decrease over time. Many find support lines in particular as a useful visual metric to use when making investing decisions.
When support and resistance lines show convergence (they indicate they will cross each other), it is referred to as a wedge. A rising wedge shows an increase in price but less price movement over time, and tends to indicate a bearish price reversal. A declining wedge shows the same trend in the downward direction — and may indicate a bullish reversal. While these patterns tend to be right a slight majority of the time, they can also lead you astray. For most, using wedges to make trading decisions wouldn’t beat a simple and straightforward crypto investing strategy (explained below and in the next article).
Chart Pattern Types
There are a plethora of chart patterns and many of them are quite complex. That being said, these patterns generally indicate one of three things: a continuation of a trend, a reversal of a trend, or a highly volatile (unpredictable) indicator. Please note, trends are not guarantees of price movement in said direction, but have proven useful enough that some traders utilized them when making certain trading decisions.
Examples of price reversal patterns include double tops/bottoms, gaps, and various head and shoulders patterns. Continuation patterns include cup and handle and symmetrical triangle. Charting patterns that indicate a breakout (significant price movement) in either direction include rounding bottom and pennants/flags. Called bilateral chart patterns, they indicate that a substantial price movement is likely but could break in either direction.
Beyond the scope of this article, there are dozens of different charting patterns and a variety of ways in which to interpret them. However, knowing some of the basics — especially support and resistance lines — can help illuminate charts that can often seem opaque and mysterious.
Crypto Trading Indicators
Outside of these charts, many traders use formulas and tools that can also lead to insights into the price movements of a specific crypto — or the crypto market in general. For example, a standard deviation calculation can be a good measure of market volatility. A higher standard deviation indicates higher volatility which typically correlates to wilder price fluctuations.
Indicators like standard deviation are often used in tandem with charts and past prices to determine market sentiment. For example, high volatility during price peaks could indicate indecisiveness or nervousness on the side of traders — perhaps wondering if the price will go up or down. Price peaks with low volatility may be signs of a bull market that is maturing and more stable.
When combined with market lows, low volatility may indicate a level of boredom and a lack of interest from traders. This may indicate a sideways market where the price may hover within a specified range for some time. When high volatility is combined with market lows, it is often a sign that traders are worried (and can foreshadow significant panic selling).
Moving averages (MAs) smooth out the price movement in charts by averaging the price movement over a specified time frame. This removes the more pronounced peaks and valleys in the price movement and can be a useful tool to clear out the signal noise in volatile-looking charts. While they can be calculated over any time frame, two of the most popular are the 50-day and 200-day MAs. Examples of MA variations include: simple, exponential, time-weighted, volume-weighted, adaptive, convergence divergence, and many others.
Sometimes trading indicators can be fairly complex. For example, bollinger bands combine standard deviations with MAs to forecast if something is either significantly oversold or overbought (which could indicate a good trading opportunity). Other indexes that are popular for crypto trading include the average directional index (ADX), relative strength index (RSI), and on-balance volume (OBV).
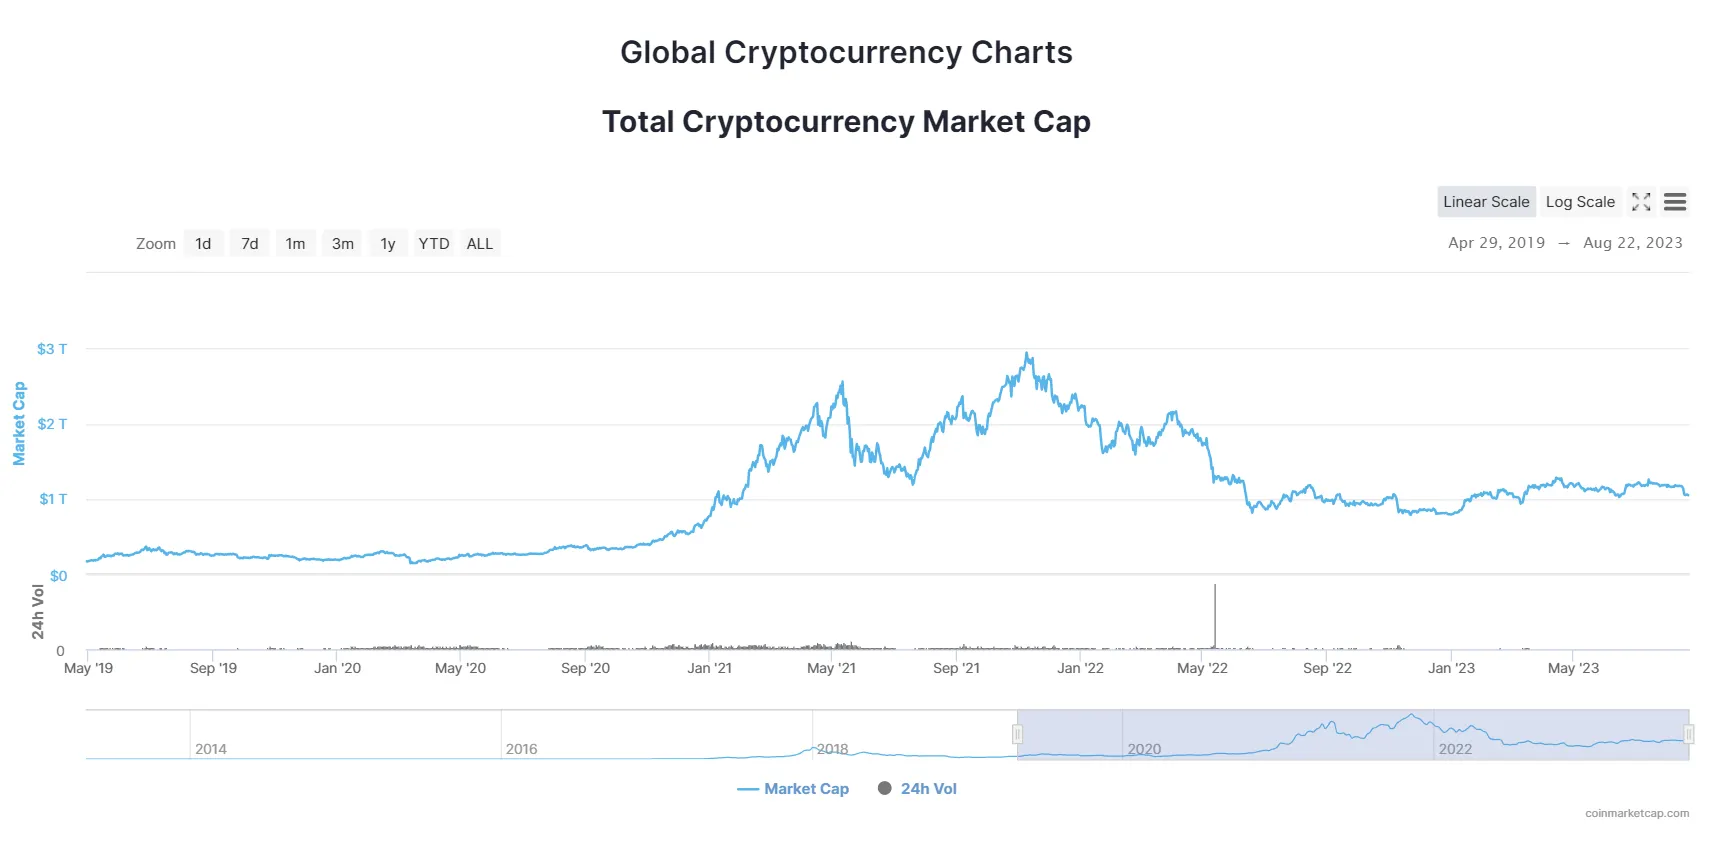
For beginners, the total crypto market cap is one of the best ways to get a zoomed out view of the entire crypto investor space. It is essentially an index that combines every (or most) cryptocurrencies into one combined price. Even though some major cryptos tend to track this index somewhat closely, it is a good way of seeing whether the entire crypto space is in a bull or bear market.
Longer-Term and Sentiment-Measuring Crypto Indicators
It’s worth noting that technical analysis-based trading is considered particularly difficult — especially the type that is focused on making very short-term intraday trades. Especially when looking at more complicated trading patterns, it is often an area best reserved for professional traders. However, some of these technical indicators focus on making longer-term price predictions (which are traditionally more associated with fundamental analysis). In addition, they may even incorporate layers that are a close proxy for bullish or bearish investor sentiment for a specific crypto or the market in general.
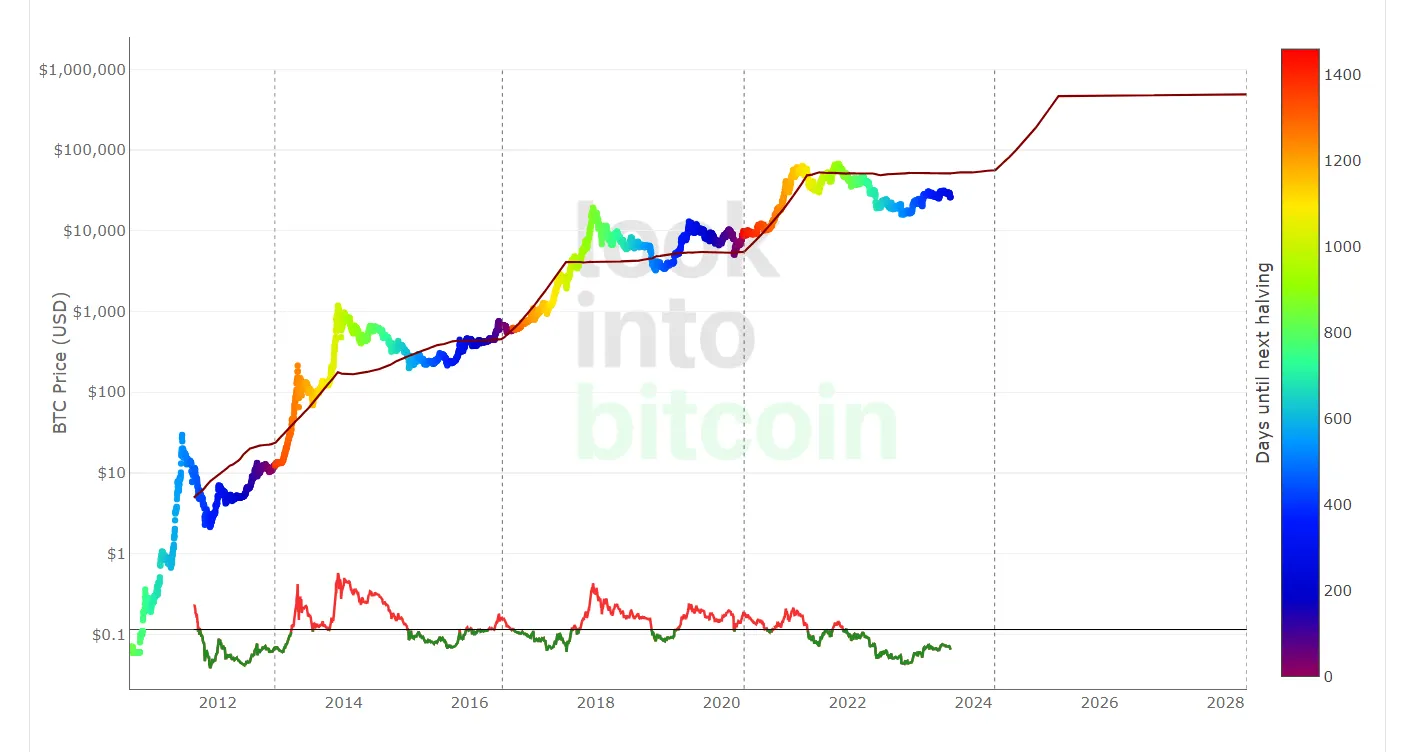
One popular indicator is the BTC Stock-to-Flow (S2F) model. It overlays the price of BTC with the stock (existing BTC supply) and the future flow (the additional BTC that are released via mining). As the flow is known and predetermined (e.g., we know that mining rewards will halve once again in April 2024), this model can be used to predict the price. It is largely based on the BTC supply flow reducing while demand stays constant (or grows). As the halving approaches, the chart changes in color to countdown the next halving.
This model has done a relatively good job of predicting past price movements. As you can see, this S2F model predicts a BTC price in excess of $100,000 by 2025 that continues to appreciate substantially.
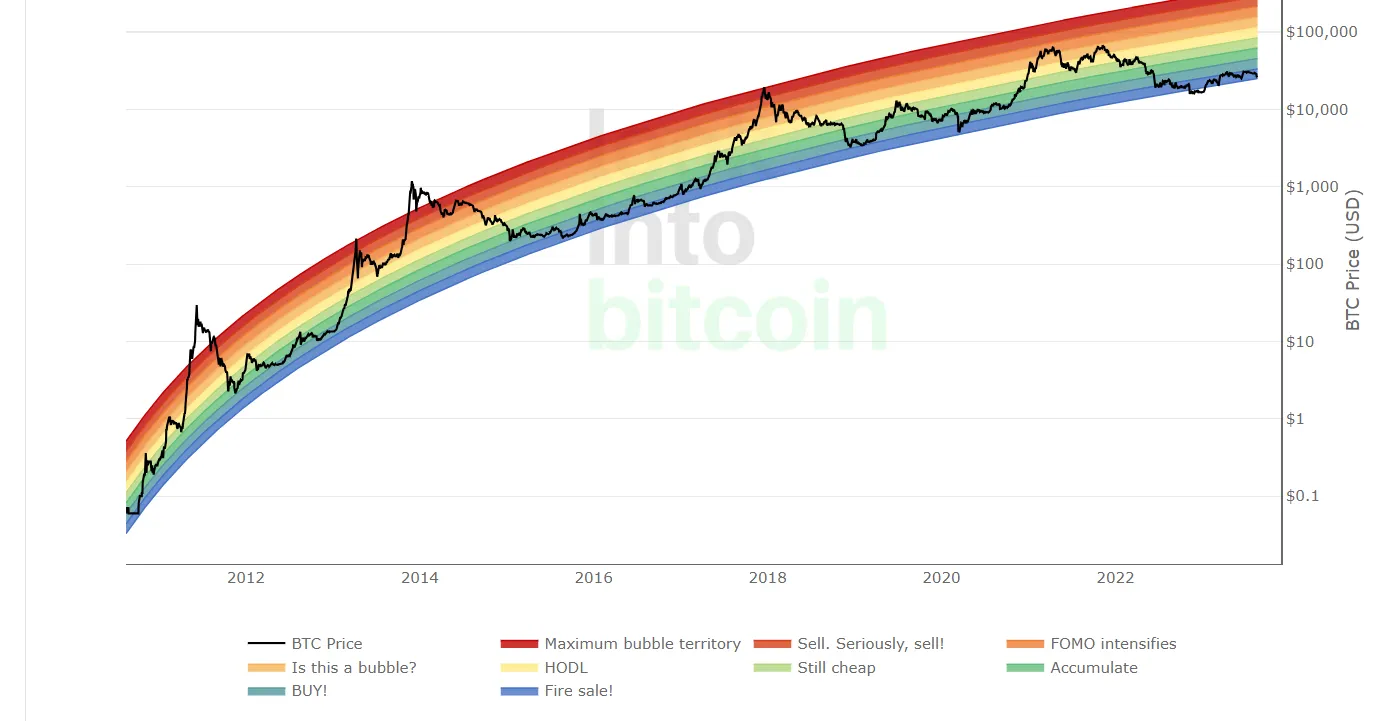
The BTC rainbow chart is an entertaining and useful visual representation of investor sentiment. From “Maximum bubble territory” at the top to “Fire sale!” at the bottom, this chart gives you some advice on when to buy, sell, or HODL. In August 2023, this chart is suggesting that the price is low and buying is a good idea. Is it? That’s up to you to decide.
A similar index is the Bitcoin Fear and Greed Index. It combines BTC price movement/volume/volatility with social media sentiment to approximate investor sentiment. With the common adage to be greedy when others are fearful — and vice versa — this index indicates when BTC investors are being too cautious or greedy (and suggests you do the opposite).
Should You Use Crypto Technical Analysis?
Technical analysis is not easy and most novice investors would do better using a very simple (but often effective) buy-and-hold strategy that waits to strategically exit for profit at future price points or later dates. If you do choose to incorporate some technical analysis and indicators into your investing arsenal, you may want to consider STF, rainbow charts, and some of the other longer-term indicators. While the indicator examples above are for Bitcoin, you can also find some similar charts for ether (ETH), the total crypto market, and a variety of other major cryptos.
While some of these models seem to accurately reflect price movements, that is no guarantee that they will continue to do so. For this reason, it is still wise to be cautious when investing within the crypto space. In the next chapter of the crypto investing crash course, we’ll cover some basic risk management strategies and some automated tools that are popular with crypto traders.
Disclaimer: This investing series is strictly for informational and entertainment purposes. It should not be construed as financial or investment advice. Do not invest based on price prediction tools or forecasts laid out in this series. Please consult an investing professional or financial planner if you feel you need investment guidance.
Cheat Sheet
- Technical analysis looks at historical price movements, charting patterns, and trading indicators to predict future price movements.
- Technical analysis is generally used to make shorter term price predictions than fundamental analysis, although some technical trading indicators forecast prices farther into the future.
- Understanding some charting basics (like support/resistance lines) can give you some visual cues that can inform your investment decisions.
- While it can be useful, many recommend crypto investing novices forgo technical analysis-led trading strategies for simple buy-hold-sell investing plans.
- Charting patterns tend to indicate one of three things: trend continuance, trend reversal, or high uncertainty and volatility.
- Crypto trading indicators (standard deviation, moving average, relative strength index) use calculations that can simplify trading data — and may be useful for making longer-term price predictions than charting patterns.
- BTC-focused indicators include Stock to Flow, Rainbow Chart, and Fear and Greed Index. These indicators may also be available for ETH and other major cryptos.
