![A chart with blue bars.](https://img.decrypt.co/insecure/rs:fit:3840:0:0:0/plain/https://cdn.decrypt.co/wp-content/uploads/2023/09/image-3.png@webp)
Ethereum paints the same picture
![A chart with blue bars.](https://img.decrypt.co/insecure/rs:fit:3840:0:0:0/plain/https://cdn.decrypt.co/wp-content/uploads/2023/09/image-4.png@webp)
$67,837.00
2.55%$3,263.73
2.30%$579.54
1.25%$182.37
5.42%$0.999954
-0.09%$0.599617
-1.15%$3,262.88
2.45%$0.133733
5.50%$6.69
0.90%$0.415904
4.80%$0.137435
1.06%$28.66
4.80%$67,864.00
2.53%$0.00001718
4.05%$13.56
3.84%$5.85
1.55%$378.89
3.76%$5.69
4.76%$7.66
4.65%$5.83
-0.65%$71.42
2.99%$0.00001194
3.50%$3,408.11
2.58%$0.513512
2.73%$9.77
-1.98%$0.182083
2.77%$22.93
3.42%$6.99
5.12%$0.998595
-0.22%$1.27
6.32%$0.103047
0.84%$163.23
-0.10%$0.850457
2.29%$1.87
3.12%$4.65
10.40%$6.69
6.82%$2.61
2.61%$350.25
6.34%$25.67
6.96%$0.068629
3.41%$40.99
2.36%$0.091355
1.69%$2,627.30
-1.52%$0.724158
3.34%$6.16
3.53%$1.55
5.58%$0.02871412
4.21%$30.93
1.87%$0.999542
-0.10%$0.00002861
4.30%$0.783693
4.47%$1.72
1.40%$0.199671
4.93%$3,654.36
2.39%$0.00018005
2.24%$3,311.94
2.59%$1.14
2.84%$3,390.01
2.65%$4.69
4.03%$1.51
6.87%$0.01427035
3.86%$10.11
0.04%$97.68
4.49%$1.074
10.93%$0.999844
3.97%$0.391768
3.05%$1.57
2.53%$0.02891865
4.30%$0.132134
8.64%$0.460456
5.32%$1.38
3.15%$6.00
4.25%$0.370965
3.76%$0.142924
4.14%$3,267.06
3.01%$73.02
0.25%$0.669568
5.80%$1.19
-0.25%$7.59
1.33%$219.57
5.33%$0.951797
13.79%$9.70
1.96%$0.01833194
6.96%$46.21
7.57%$33.44
2.59%$6.09
6.48%$5.30
0.33%$0.02372188
5.03%$0.0000009
7.90%$26.71
1.65%$0.576438
3.24%$0.01930466
2.01%$11.88
6.21%$10.41
2.70%$3,323.49
2.36%$38.62
7.10%$3.33
6.92%$1.30
4.83%$0.461505
7.31%$0.00003884
14.85%$0.777472
3.60%$0.329057
6.88%$2.33
-0.48%$0.175486
18.84%$1.00
-0.07%$0.0080045
5.47%$2.07
3.03%$0.535796
4.73%$2.35
9.91%$0.00000033
3.92%$1.21
2.33%$3,516.63
2.29%$0.996632
-0.21%$0.343357
6.64%$2.40
9.91%$0.070246
5.01%$3,264.91
2.70%$3.89
4.68%$1.00
-0.14%$0.00000166
-2.63%$0.524486
5.61%$0.088336
4.25%$0.00860102
7.33%$0.161005
3.11%$2,386.24
0.75%$0.532601
11.21%$1.74
5.23%$0.165511
4.45%$214.56
-1.89%$0.01235829
3.23%$9.51
2.37%$3,470.04
2.30%$0.143769
3.08%$0.789143
5.03%$0.075101
3.84%$0.29129
4.03%$4.69
2.30%$0.92935
12.30%$15.11
4.94%$3,563.10
2.40%$1.16
0.63%$0.676926
3.37%$1.00
-0.18%$32.36
5.71%$0.371848
2.37%$0.03124913
0.89%$0.00008544
4.38%$26.35
6.21%$1.98
2.60%$0.06898
4.41%$0.421405
6.88%$0.526974
13.19%$67.78
-2.74%$2,385.36
0.50%$1.023
2.46%$0.00000043
0.34%$0.00423237
4.14%$0.04480309
1.22%$1.024
0.66%$0.00598225
2.95%$0.080714
5.18%$0.994427
-0.06%$3.25
21.58%$0.481455
2.34%$3.98
1.26%$0.052951
0.93%$0.198026
4.02%$3.19
-10.60%$3,378.31
2.27%$2.18
6.12%$0.973822
6.54%$0.778891
-1.57%$51.34
2.45%$1.45
4.99%$0.01548694
4.08%$0.775129
10.08%$0.153604
7.20%$65.61
2.68%$0.19011
18.86%$0.345547
6.22%$0.550038
4.96%$16.29
3.12%$0.188401
4.66%$1.72
7.67%$21.61
4.50%$0.193466
-1.93%$0.38791
9.84%$0.487189
3.02%$8.19
1.66%$0.598541
6.79%$0.0172152
4.86%$0.04810424
-1.43%$0.138978
6.07%$26.96
4.32%$7.44
2.96%$0.00092546
-2.49%$0.265445
4.61%$0.189523
4.93%$6.81
15.95%$0.03082631
6.30%$0.566622
5.17%$0.00531576
2.88%$0.00170694
3.02%$0.02870697
5.83%$0.741073
9.27%$2.55
5.96%$1,362.33
3.04%$1.30
5.25%$0.27384
7.60%$0.02965278
2.71%$3,424.68
2.31%$0.193346
5.03%$1.98
-1.16%$67,859.00
2.81%$0.629073
31.41%$0.394322
2.61%$0.41486
5.09%$2.98
11.13%$29.35
2.06%$0.01539406
1.91%$0.073863
3.75%$48.87
7.83%$2.56
4.84%$2.60
4.94%$0.00529053
5.69%$0.01906643
2.51%$71.60
7.30%$0.02128241
2.54%$0.307054
7.05%$0.04865131
6.55%$3.84
3.64%$0.998486
-0.27%$0.696317
3.47%$2.10
16.11%$3,408.39
2.32%$0.48581
2.47%$0.00429077
2.93%$2.39
4.62%$33.21
4.86%$0.02941782
4.32%$0.277775
-0.90%$2.82
-1.03%$0.554736
6.28%$2.74
8.44%$0.02321746
5.61%$1.56
17.77%$0.00070334
-1.97%$1.048
-0.28%Bitcoin's spot trading volumes for the current quarter have totaled $721.10 billion, according to CoinGecko data.
If September's volumes mirror those of July and August, it will mark the lowest trading volumes for a quarter since Q1 2019. Quarterly trading volumes hovered over $2 trillion for most of the time between 2019 and 2023.
Over the previous two months, Bitcoin saw trading volumes of $345.89 billion and $354.84 billion, respectively.
If conditions remain unchanged and September's volumes hover around $350 billion, the quarterly trading volumes would come close to $1.05 trillion.
For comparison, last quarter, the total quarterly trading volumes were $1.25 trillion, marking a potential 14% decline month over month.
CoinGecko data shows that the total trading volume for Bitcoin in the first quarter of 2019 was $541.3 billion.
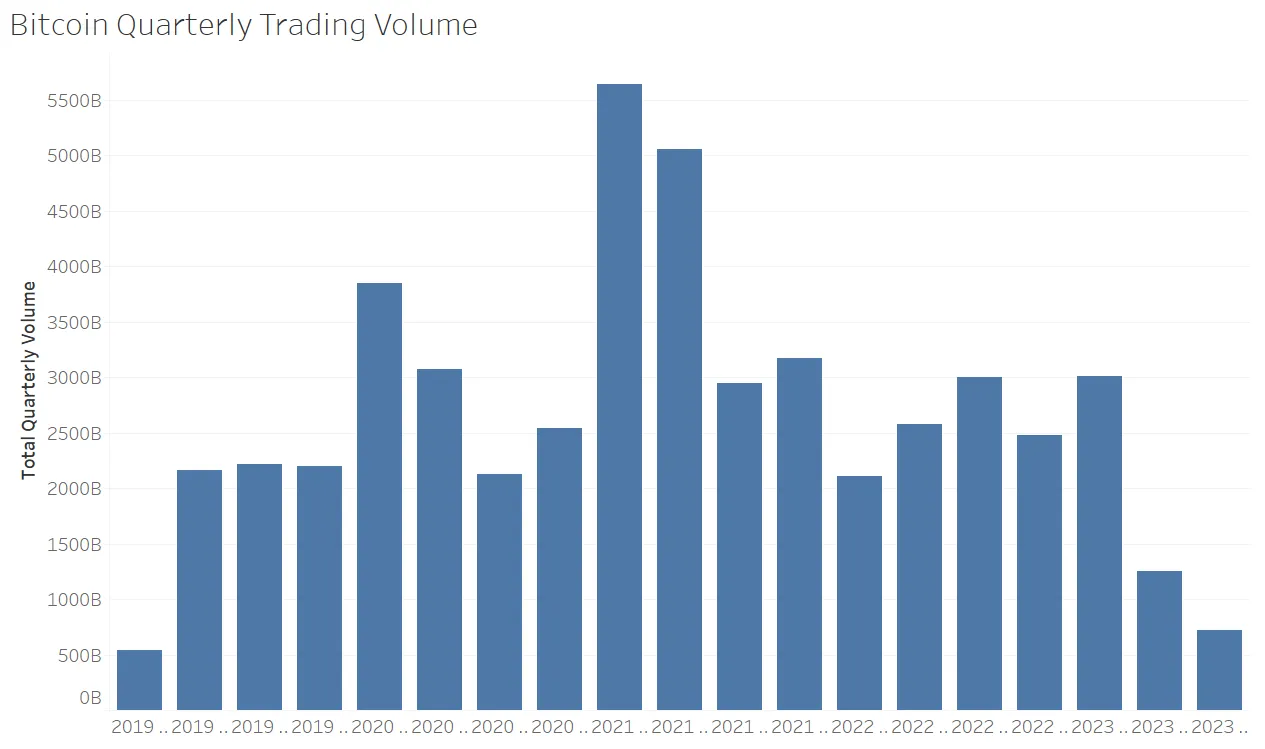
Bitcoin quarterly trading volumes. Source: CoinGecko.
The conditions are similar for Ethereum (ETH).
In July and August, ETH recorded trading volumes of $232.06 billion and $212.92 billion, respectively.
If Ethereum’s September trading volumes reach approximately $220 billion, the cumulative quarterly trading volume for ETH would be just over $650 billion, a level not seen since 2019.
In Q4 2019, the total spot trading volumes for ETH amounted to $740.64 billion.
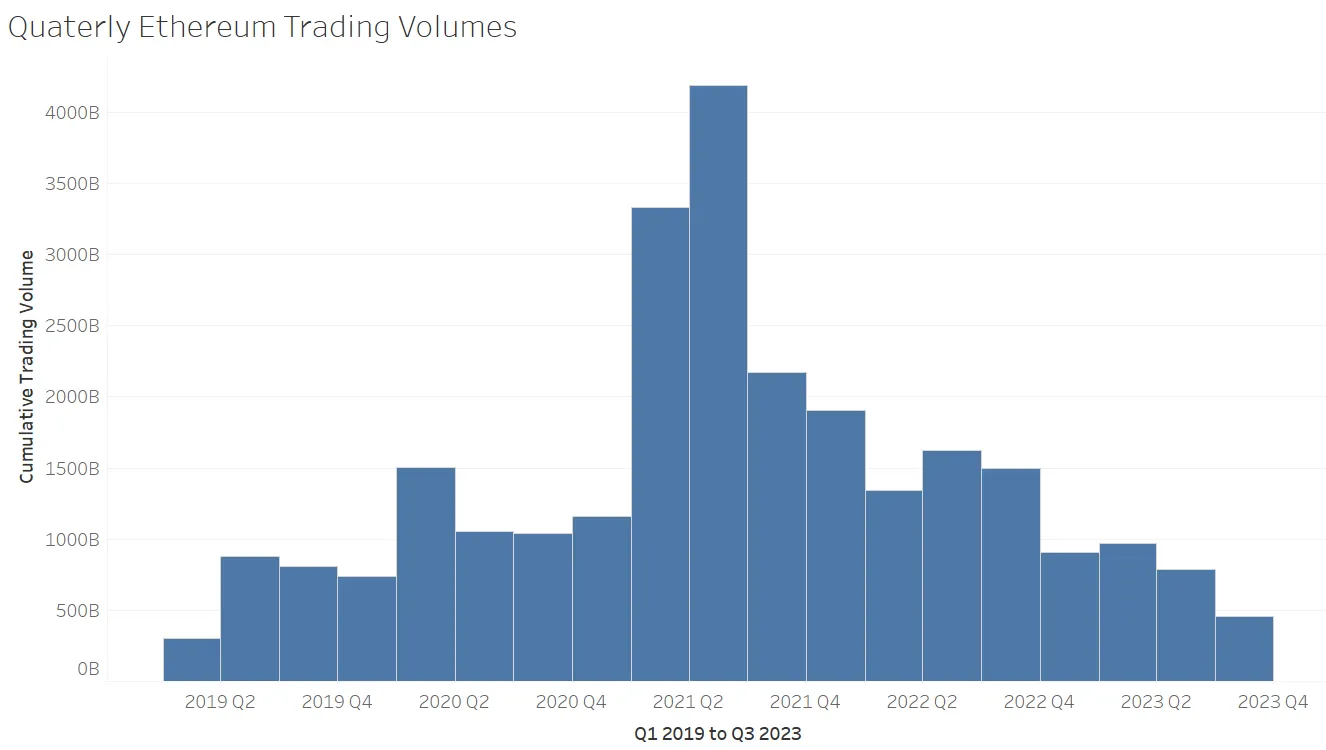
Ethereum quarterly trading volumes. Source: CoinGecko
According to a previous CoinGecko report, spot trading volumes for the entire crypto market on centralized crypto exchanges dropped by 43% in the second quarter of 2022.
Institutional trading firm Genesis Trading said in its last quarter report that derivatives will likely play a crucial role in the future growth of crypto volume, with “spot market liquidity suffering and spot order book depth chronically flagging.”