Disclaimer
The views and opinions expressed by the author are for informational purposes only and do not constitute financial, investment, or other advice.
$78,695.00
-4.91%$2,400.94
-11.27%$778.89
-8.18%$1.57
-10.33%$0.999611
-0.01%$103.21
-11.27%$0.285277
-2.53%$2,401.24
-11.26%$0.102056
-12.09%$1.005
-3.28%$49.21
-3.21%$0.285073
-12.31%$2,943.91
-11.18%$78,262.00
-5.57%$486.24
-11.82%$0.999749
-0.00%$0.998307
-0.01%$2,614.12
-11.23%$445.30
-2.25%$8.75
-5.06%$2,610.70
-11.16%$28.48
-4.46%$9.61
-10.81%$0.18149
5.80%$0.990832
-0.65%$78,838.00
-4.89%$0.172505
-9.97%$2,404.23
-11.48%$0.997821
-0.14%$296.34
-11.09%$58.11
-10.89%$0.999419
0.14%$1.083
-0.17%$1.11
-12.82%$9.80
-10.29%$0.00000656
-10.04%$0.087835
-11.45%$1.21
-0.36%$0.134632
-11.93%$1.00
0.15%$4,824.78
-0.88%$1.31
-9.26%$0.00903398
-4.40%$0.077
-7.47%$1.50
-11.24%$3.82
-10.34%$0.699182
-9.62%$3.25
-4.92%$1.27
-9.43%$0.994598
0.01%$4,839.77
-1.12%$123.64
-10.98%$88.89
-11.68%$189.70
-10.79%$0.00000409
-11.86%$1.00
0.00%$1.11
0.01%$0.999633
0.01%$0.00000172
-2.37%$4.10
-6.28%$1.17
-10.68%$1.15
-0.04%$0.00247682
-10.01%$9.51
-10.63%$129.41
-11.32%$2,555.08
-11.42%$2,398.93
-11.10%$2.64
-12.11%$0.060568
-6.58%$0.156362
-5.46%$1.00
0.02%$0.274359
-12.27%$103.11
-11.58%$0.99808
0.05%$0.532364
-12.33%$0.999612
-0.01%$0.0238027
2.16%$9.26
-8.27%$778.80
-7.89%$8.39
-10.27%$112.79
-11.35%$0.394541
-15.92%$0.998566
-0.00%$0.100047
-10.31%$0.131347
-14.49%$2,780.04
-11.34%$4.32
-4.61%$64.87
-8.95%$1.92
-8.70%$1.23
-15.15%$4.82
-11.78%$78,828.00
-5.14%$0.099741
-10.76%$0.998971
0.02%$77,792.00
-5.60%$0.03215424
-14.20%$0.999611
-0.01%$10.97
0.00%$0.826396
-8.23%$1.11
0.02%$0.136417
-11.71%$0.04722332
-9.07%$1.48
-11.37%$0.00918884
-8.68%$1.016
-13.49%$0.999293
-0.06%$1.024
0.00%$1.15
4.48%$2,618.25
-11.37%$114.15
0.02%$0.00804373
-13.25%$0.0344306
-5.74%$2,561.54
-12.31%$28.70
-5.08%$1.24
-0.14%$78,820.00
-4.90%$0.99932
-0.06%$1.29
4.02%$78,508.00
-5.03%$0.999235
-0.02%$0.00000695
-13.90%$1.11
-7.27%$77,842.00
-5.77%$0.997147
-0.40%$0.076099
-3.90%$2,405.97
-11.07%$1.093
0.00%$0.084559
-10.06%$2,555.63
-11.47%$0.170772
-15.10%$43.90
-13.24%$2,570.42
-11.39%$0.00918181
-8.88%$26.49
-25.26%$1.46
-19.08%$1.57
-10.04%$0.01303296
-0.45%$0.999356
0.03%$119.93
-11.71%$1.50
-11.27%$2,405.18
-11.08%$0.997537
-0.01%$0.453944
-10.50%$1.088
0.09%$0.00748292
-15.67%$77,943.00
-5.67%$0.997009
0.00%$0.251628
-12.15%$0.101187
-10.72%$0.226193
-14.52%$0.0430213
-11.52%$87,884.00
0.00%$0.02336055
1.33%$0.282863
-11.64%$1.19
-0.07%$0.62245
-15.75%$0.179949
-12.49%$0.999008
0.10%$2,400.59
-11.10%$1.13
0.01%$0.934553
-6.07%$1.12
0.02%$2,583.50
-11.34%$153.69
-0.44%$0.104671
-12.78%$1.47
-15.43%$0.00000037
-4.34%$78,789.00
-5.25%$0.04007284
-3.46%$139.25
-11.59%$0.411184
-12.65%$3.47
-13.25%$2,690.81
-11.48%$0.367157
-10.40%$1.65
-15.62%$0.28793
-14.55%$0.00000034
-1.33%$0.01721885
-6.14%$2,594.64
-11.48%$0.469607
-13.21%$0.00003395
-12.64%$87.05
-1.54%$0.053616
-6.99%$1.037
3.72%$122.90
-12.32%$15.62
-7.37%$1.83
-13.01%$0.355296
-13.02%$0.02891243
-12.05%$115.61
-11.93%$0.989542
-1.20%$17.61
1.77%$0.72838
-10.62%$0.999702
-0.02%$78,675.00
-5.09%$0.06905
-10.44%$0.050747
-14.04%$0.996232
-0.22%$0.04068009
11.72%$18.38
-8.55%$2,317.30
-14.58%$0.142035
-14.82%$2.27
-0.73%$0.280313
-1.76%$0.05415
-13.36%$0.053597
-12.18%$0.00563086
-9.75%$0.991884
0.14%$0.00273113
-2.47%$0.101228
-11.21%$0.00278758
-12.24%$6.86
-15.18%$0.101782
-12.06%$78,902.00
-4.93%$1.083
3.49%$1.064
-0.08%$0.14133
4.69%$0.270638
-17.17%$1.54
-15.70%$1.54
-0.21%$2.56
-12.27%$0.02114148
-13.52%$78,726.00
-5.20%$0.246738
-15.40%$0.132766
-5.93%$21.76
0.49%$827.34
-7.63%$78,683.00
-4.40%$0.999661
0.00%$0.998857
-0.06%$12.20
-10.51%$0.00000107
-1.92%$77,155.00
-7.00%$0.00227607
-11.78%$0.00470069
-12.87%$0.999919
-0.01%$0.101605
-18.26%$0.986903
-0.11%$1.13
5.58%$0.216482
-13.83%$0.999621
-0.00%$2,401.39
-11.23%$0.999496
-0.00%$28.38
-5.03%$1.02
1.03%$0.110539
-11.59%$0.999728
0.04%$0.77785
-14.95%
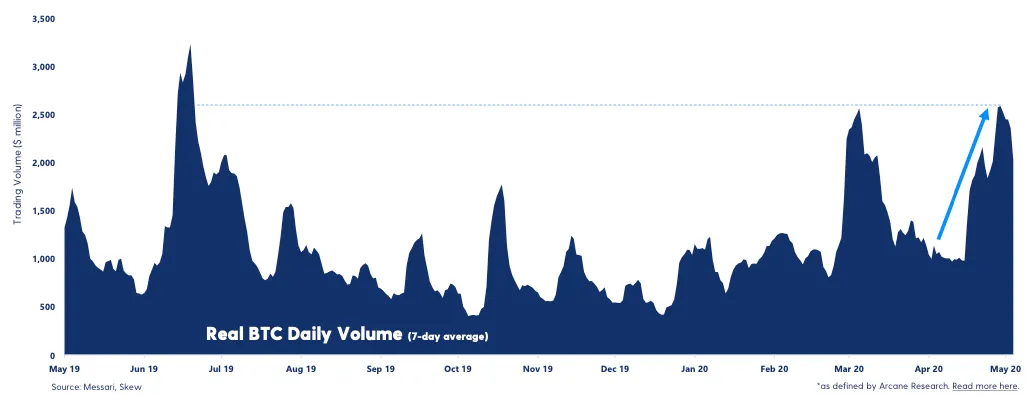
Bitcoin (BTC) trading volume has just reached a 2020 high as a result of recently renewed interest in the cryptocurrency—largely due to the Bitcoin halving.
According to cryptocurrency exchange Luno, an average of $2-3 billion worth of cryptocurrency regularly changed hands per day through May 2020—more than triple that seen throughout most of April. This value represents only real trading volume—defined as the total transaction volume from the ten exchanges that blockchain analysis platform Arcane Research and data providers Messari consider to be credible. These exchanges include Coinbase, Gemini, and Poloniex.
This value now exceeds the volume seen during the recent sell-off that occurred in early to mid-March, when Bitcoin crashed from over $9,100 down to just $4,100 in under a week and trading volumes skyrocketed up to a 7-day average of around $2.5 billion.

Bitcoin's trading volume is now at its highest point since July 2018, a time in which its 7-day average trading volume briefly topped $3 billion per day while the price of Bitcoin spiked to over $13,000. Following this, Bitcoin's average trading volume dropped off a cliff, and hovered between $500 million and $1 billion per day throughout much of 2019, before picking up towards the end of the year.
This gradually improving volume comes during a bullish 2020 so far. At its current value of $9,660, Bitcoin is now up more than 34% since the start of the year, with much of this growth coming as a result of a significant market rally between mid-March and today.
The number of searches for Bitcoin on Google has also more than doubled since the start of the year. Search volume for Bitcoin is now at its highest point since June 2019, indicating a renewed focus on the cryptocurrency. Even JK Rowling's talking about it.
Disclaimer
The views and opinions expressed by the author are for informational purposes only and do not constitute financial, investment, or other advice.
