In brief


Disclaimer
The views and opinions expressed by the author are for informational purposes only and do not constitute financial, investment, or other advice.
$78,192.00
1.75%$2,284.07
1.65%$774.28
2.32%$1.61
1.60%$0.999702
-0.00%$103.71
1.86%$0.283615
-0.16%$2,290.62
2.10%$0.107688
4.26%$1.033
1.26%$51.54
3.61%$0.297273
3.19%$529.36
3.15%$2,831.90
3.16%$78,270.00
2.38%$1.00
0.04%$0.998965
-0.01%$37.28
21.55%$2,503.94
2.52%$8.62
-0.24%$2,494.33
2.48%$0.190482
5.67%$371.72
-5.92%$9.64
2.28%$0.998202
-0.06%$78,381.00
2.10%$0.177566
1.27%$2,297.43
2.44%$1.00
0.05%$288.13
-2.39%$59.90
2.64%$1.00
0.19%$1.14
2.70%$10.09
2.04%$1.085
0.29%$0.00000686
3.14%$0.091275
1.73%$1.22
0.08%$1.00
-0.02%$0.128951
3.89%$4,908.83
5.93%$1.37
3.13%$0.082708
6.11%$0.00909342
-2.38%$1.49
12.39%$1.53
1.87%$3.90
0.83%$0.729
3.98%$4,931.36
5.76%$3.07
1.55%$0.994288
0.07%$127.69
2.06%$196.75
3.99%$88.17
1.49%$0.00000419
2.46%$1.00
0.00%$1.11
-0.00%$0.00000174
0.99%$0.999618
0.00%$1.19
2.60%$4.10
1.25%$9.75
3.38%$130.40
1.89%$1.15
-0.04%$0.00248291
2.10%$2.69
1.03%$0.592324
7.44%$0.999636
0.02%$0.062525
4.22%$2,454.18
3.12%$2,302.25
2.77%$0.158753
2.48%$0.282825
3.29%$103.30
1.52%$0.998891
0.04%$0.999694
-0.00%$9.29
4.51%$0.115985
13.88%$778.42
2.80%$0.02130083
1.50%$6.05
7.76%$8.22
2.24%$0.405413
2.75%$0.13874
2.02%$113.67
2.28%$0.999195
0.03%$4.25
2.77%$68.03
1.87%$1.99
4.15%$1.27
1.82%$2,657.83
2.39%$0.105507
4.11%$78,638.00
2.42%$0.03321425
7.97%$1.001
0.34%$0.999703
0.01%$37.63
21.36%$77,098.00
0.23%$0.00997493
1.02%$1.57
3.99%$10.98
0.01%$1.11
0.05%$1.083
5.15%$0.04844302
3.01%$0.802413
0.77%$0.135749
1.42%$1.001
0.12%$0.00847207
3.40%$1.024
0.00%$0.03728224
2.78%$1.29
14.32%$1.10
-0.48%$114.17
0.02%$2,475.87
1.81%$1.24
-0.34%$78,378.00
2.40%$0.999834
-0.01%$0.194073
6.88%$0.00000714
2.29%$2,414.91
2.22%$0.999052
-0.06%$0.081269
0.54%$78,102.00
2.40%$78,832.00
2.69%$0.089816
5.18%$0.00995094
0.87%$0.997967
0.04%$1.093
0.00%$44.05
1.20%$2,294.71
2.10%$0.304319
19.56%$2,441.99
2.27%$1.59
4.01%$1.62
2.04%$2,457.94
2.53%$0.485135
6.16%$0.9994
0.06%$120.61
1.73%$0.01294921
1.16%$0.02804391
4.40%$0.998587
-0.05%$1.40
-0.61%$0.00767485
2.28%$78,348.00
2.31%$1.086
-0.12%$2,295.29
2.53%$0.04391971
-3.09%$0.228708
0.92%$0.998107
0.07%$0.101078
2.32%$1.72
14.38%$0.64497
4.01%$1.18
-0.38%$0.286317
2.83%$0.183569
1.20%$0.987928
-1.18%$1.00
0.04%$1.13
0.03%$2,282.84
1.88%$78,319.00
1.80%$0.109676
3.09%$157.85
5.91%$1.12
0.01%$0.04212744
3.41%$1.81
6.05%$3.67
2.94%$2,491.88
3.37%$0.397652
3.62%$0.0186829
8.56%$78,171.00
2.11%$0.308403
7.44%$0.060656
11.30%$0.415074
-0.14%$140.55
1.98%$0.500964
2.58%$0.00000035
1.53%$0.00000035
4.13%$0.00003559
4.87%$1.032
0.05%$89.01
13.93%$2,575.08
2.35%$0.373059
3.92%$18.96
0.17%$0.03014425
2.53%$126.90
2.34%$0.074521
4.06%$2,479.75
2.24%$15.44
1.79%$0.998488
1.08%$2,294.00
1.43%$114.81
2.60%$0.999852
0.00%$0.00609788
5.29%$0.056515
3.88%$78,331.00
2.18%$0.00309386
12.71%$0.051179
1.43%$0.146534
2.03%$1.003
0.32%$0.055814
1.92%$14.47
-14.42%$0.304421
2.55%$0.672008
-0.13%$0.962217
-3.25%$17.73
-0.98%$0.108015
4.64%$0.991456
0.05%$0.00275675
-0.69%$2.18
-1.57%$0.100529
1.06%$1.56
-5.91%$6.89
1.73%$37.28
21.28%$0.142823
0.73%$0.25808
-0.00%$78,386.00
2.11%$0.255809
4.20%$0.03472493
-1.29%$1.53
-1.91%$1.065
0.12%$0.02349185
-5.66%$78,275.00
1.80%$2.49
6.04%$1.011
-3.21%$77,794.00
1.30%$825.35
3.05%$12.55
1.68%$21.35
2.60%$0.99959
0.00%$3.23
2.30%$1.40
-1.66%$78,033.00
2.35%$1.002
0.49%$0.0047707
2.23%$0.221622
-0.10%$1.16
3.85%$0.220337
3.82%$0.999992
0.01%$0.100673
-2.23%$0.113429
1.24%$0.987442
0.00%$0.0022156
1.52%$5,727.49
1.59%$0.999905
-0.00%$0.218744
0.20%$0.999509
-0.02%$0.213488
4.67%$0.00000102
-1.41%
Ethereum today hit its highest price since 2018. But the network’s far more popular than it was two years ago, one metric shows.
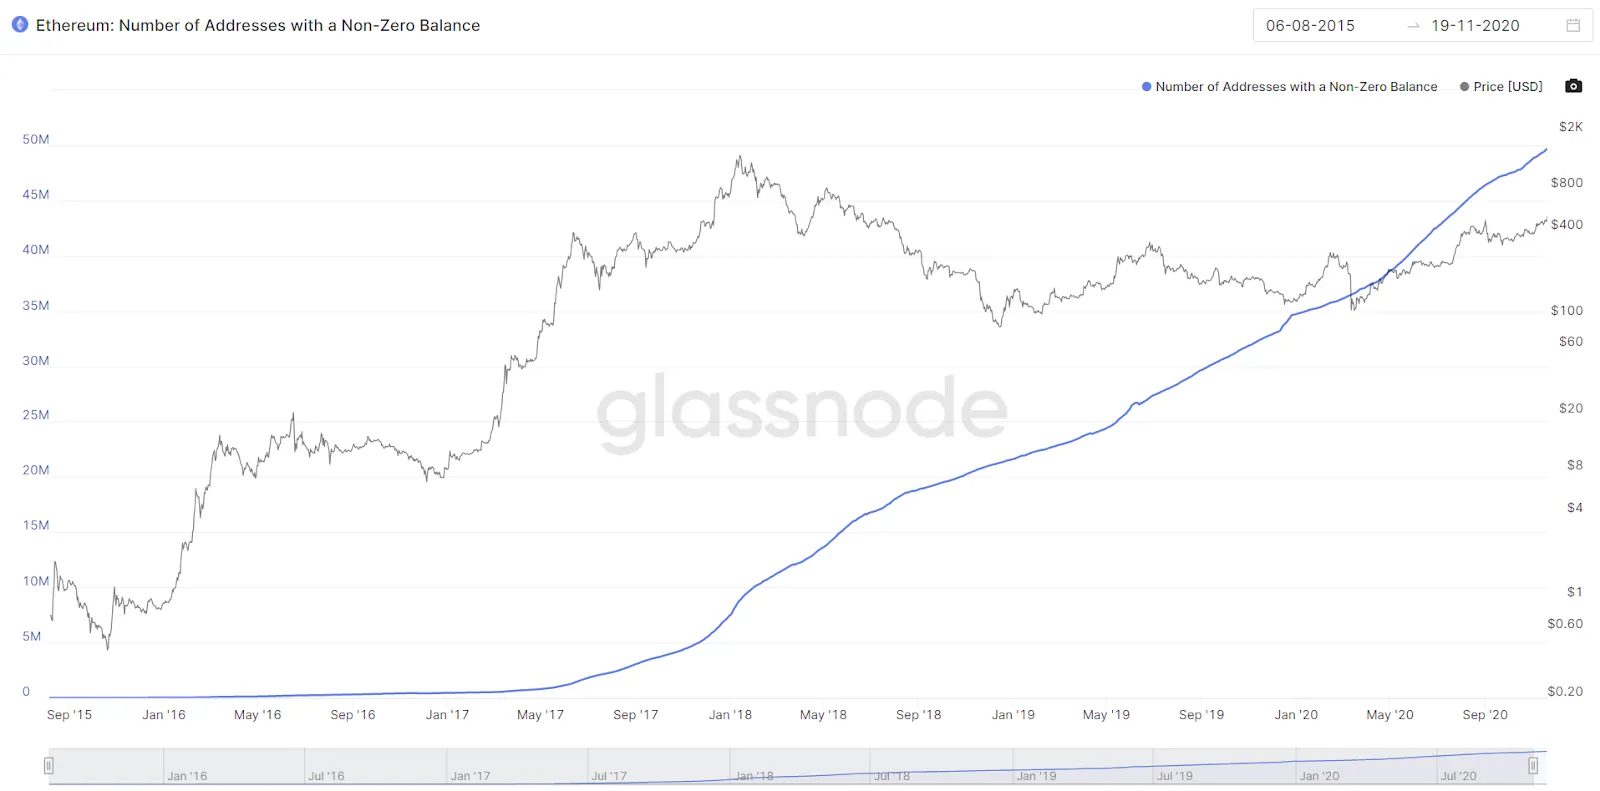
According to data from Glassnode, more Ethereum addresses held ETH this year than in any other year since Ethereum’s launch in 2015.

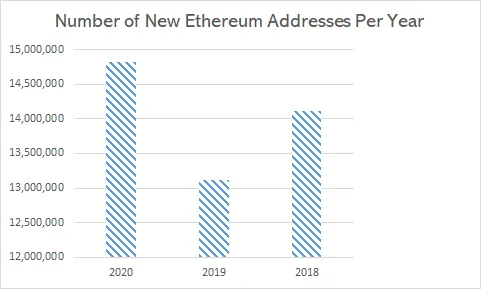
This year so far, the Ethereum network added an extra 14,820,771 million Ethereum addresses that hold money—i.e., wallets that held a non-zero balance. As of this writing, there are 49.6 million such wallets. That’s an all-time high.
2020, for all its foibles (of which there are innumerable), has been a far more successful year for bringing more people to the Ethereum flock than the previous two years, the time period for which Ethereum really took off.
It’s a 13% increase compared to last year, when the network added 13,120,403 non-empty Ethereum addresses. And it’s a 5% increase compared to 2018, when it added 14,114,642.

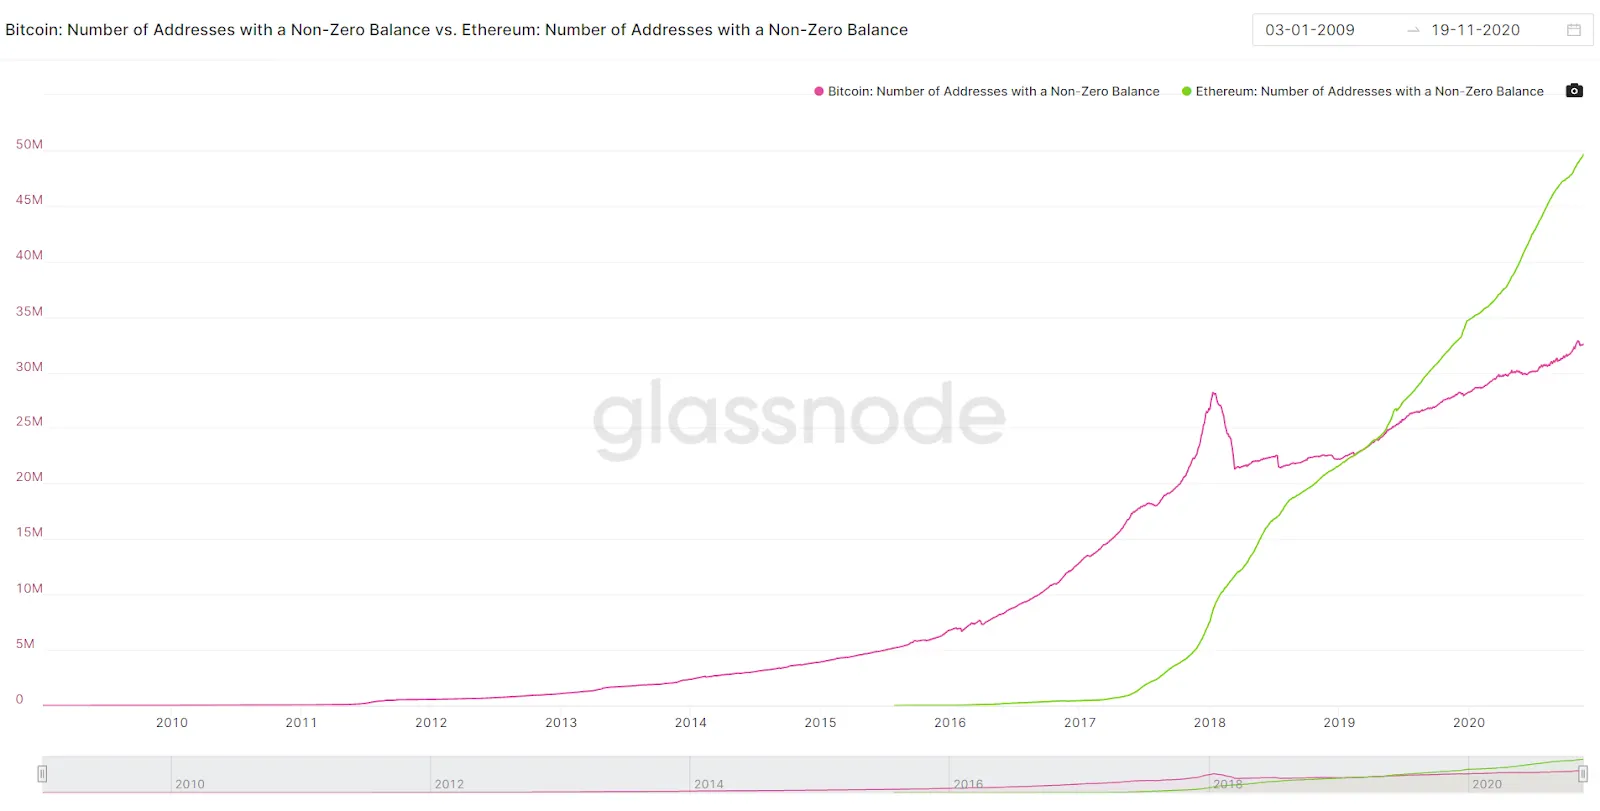
And there are far more Ethereum addresses with a non-zero balance than Bitcoin. As of this writing, there are 32.5 million Bitcoin addresses with at least some Bitcoin held within them, far below Ethereum’s 49.7 million. Ethereum surpassed Bitcoin in May 2019.

Of course, it should be noted that a single ETH address does not correspond to a specific user—ETH addresses are very easy to create and require no form of identification—but it suggests that more people are using Ethereum than in previous years.
Disclaimer
The views and opinions expressed by the author are for informational purposes only and do not constitute financial, investment, or other advice.
