
Last month, crypto analytics company Nansen released six new indexes for tracking the NFT market.
A recent report now reveals some striking conclusions pulled using this batch of indexes.
The six indexes split the market into handy subdivisions: The “NFT 500” (akin to the S&P 500), the “Blue Chip-10” index (the ten biggest “notable” and “classic” NFT collections by market cap), the “Social-100,” which includes popular profile picture NFTs like Bored Ape Yacht Club or World of Women, and three other indexes for “Art,” “Social,” and “Metaverse” NFTs, which need no explaining.
Using these trackers, Nansen has collected various correlations between different types of NFT collections and the wider crypto market.
NFTs outpace crypto markets
Firstly, NFTs have been crypto’s most bullish subdivision.
While most crypto markets have experienced a hefty correction of late, NFTs blazed ahead with a performance of 90.9% year-to-date (YTD) when denominated in ETH, and 35.9% YTD when denominated in the greenback.
Since January 1, the period in question, Bitcoin has dropped roughly 17% and Ethereum has fallen more than 31%, according to CoinMarketCap.
No matter how you look at it, NFTs are posting gains while cryptocurrencies have generally posted losses this year.
Another intriguing finding of Nansen’s NFT-500 data for the year-to-date is that the price of NFTs, when denominated in Ethereum, has an inverse correlation with spot crypto prices.
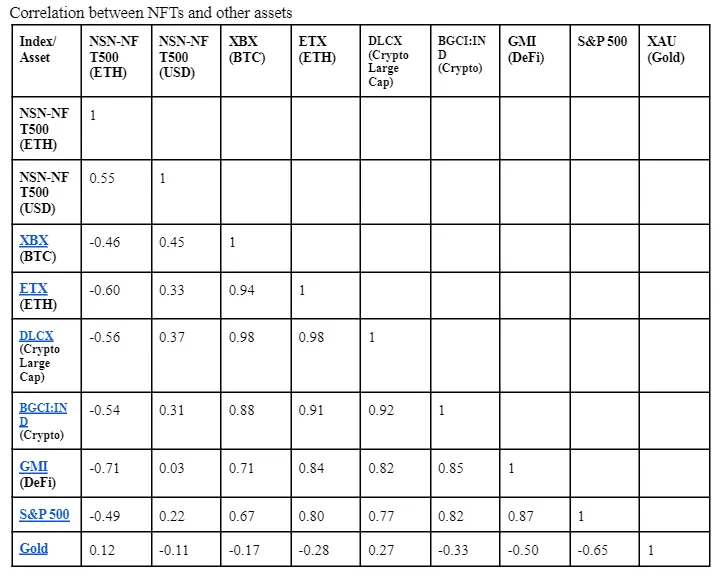
Data provided from Nansen indicates that its NFT 500 index (in ETH terms) has a -0.46 correlation coefficient with Bitcoin. The same index has a -0.6 correlation with Ethereum (also in ETH terms).
When measuring correlation coefficients “1” indicates a direct positive correlation, meaning the two variables are moving in lock stop. Conversely, “-1” indicates that the two variables are moving in opposite directions.
However, when examining the price of NFTs in dollar denominations, a positive correlation emerges between the two assets.
The reason for this discrepancy is primarily due to volatility, Nansen said.
"When NFTs are priced in USD their performance also varies widely. This is due to the volatility in the ETH/USD exchange rate. As such, the resulting correlation coefficients also differ,” research analyst at Nansen, Louisa Choe, told Decrypt. “This may be an important factor for investors when deciding on whether the denomination of their portfolio should be in cryptocurrencies or fiat currencies."
Nansen’s NFT-500 index data (denominated in Ethereum) also shows a strong inverse correlation with lesser-known decentralized finance (DeFi) tokens listed in Bankless’s DeFi Innovation Index.
So, when the Ethereum price of NFTs is high, DeFi token dollar prices are typically lower. It should be noted that Bankless’s index tracks “promising early-stage DeFi projects which are not yet considered ‘blue chip.’”
Which collections have performed the best?
The best performing division of this group are non-fungible art and social tokens. Analytics by Chainalysis published at the beginning of the year puts the market a capitalization of nearly $41 billion, and Nansen records that social tokens alone account for $12.8 billion, or about 30% of that.
Art NFTs have generated year-to-date returns of 191.8% (denominated in ETH) and 108.1% (USD).
During the same period (ending February 28, 2022), the Social-100 index showed returns of 114.8% (ETH) and 53.2% (USD).
Regarding daily volatility, or the metric that measures the average difference between the return on a given day and the average return over a given time period, Art NFTs take the cake.
Art NFTs post a daily volatility of 36% (ETH) and 37.3% (USD), while metaverse and social tokens are the least volatile, with figures well below 10% in all denominations of volatility.