Disclaimer
The views and opinions expressed by the author are for informational purposes only and do not constitute financial, investment, or other advice.
$84,208.00
-5.47%$2,810.88
-6.73%$862.19
-4.32%$1.80
-6.08%$0.9997
0.00%$117.05
-6.59%$0.292886
-0.20%$2,809.94
-6.69%$0.116394
-7.03%$1.037
1.09%$0.334288
-6.56%$3,444.26
-6.68%$557.01
-5.80%$51.52
-5.12%$84,000.00
-5.45%$3,060.94
-6.73%$0.999572
0.01%$3,055.47
-6.71%$0.998181
-0.06%$9.22
0.10%$456.32
-2.42%$11.07
-6.45%$32.47
-2.24%$84,109.00
-5.59%$0.17793
7.45%$0.998011
-0.08%$0.198753
-4.90%$2,809.13
-6.82%$349.34
-7.17%$65.83
-5.02%$0.998877
-0.05%$1.32
-6.33%$11.03
-8.45%$0.998032
-0.08%$0.100908
-5.68%$1.084
-0.04%$0.00000736
-5.64%$0.157032
-4.54%$0.999833
0.15%$1.22
-0.01%$1.46
-4.05%$0.087805
-3.13%$0.00946381
-5.09%$1.74
-6.67%$5,395.23
0.21%$4.39
-9.16%$0.839422
-8.08%$1.54
-0.05%$3.47
-3.26%$5,426.23
0.47%$147.15
-7.96%$0.993004
-0.19%$102.52
-4.04%$220.75
-7.34%$0.00000471
-5.48%$1.38
-6.88%$0.00288202
-7.21%$2,987.91
-6.74%$2,810.96
-6.72%$1.00
0.00%$3.07
-4.99%$10.80
-6.16%$147.18
-6.54%$4.41
-3.91%$0.00000177
-0.22%$1.11
0.00%$0.999689
0.00%$0.314774
-7.74%$0.620143
-6.93%$0.064787
-3.24%$117.04
-6.72%$0.999856
0.03%$1.15
0.02%$0.162609
-4.28%$10.30
-4.68%$862.21
-4.31%$0.475204
-7.20%$0.997838
-0.01%$0.999617
-0.01%$128.12
-6.70%$0.02359109
-3.34%$0.157813
-8.16%$0.112554
-4.59%$3,250.40
-6.70%$1.49
-7.57%$9.45
-4.84%$0.998687
-0.08%$5.55
-5.12%$72.54
-6.05%$2.13
-4.61%$0.03841869
-3.17%$0.115157
-5.39%$84,354.00
-5.33%$84,233.00
-5.83%$0.158491
-7.18%$4.57
-3.65%$1.75
-9.94%$0.903571
-4.22%$0.0543
-6.26%$1.19
-6.59%$44.26
-9.81%$0.998371
-0.03%$0.01024594
-4.55%$0.9997
-0.00%$10.97
0.01%$0.00945186
-7.14%$3,045.56
-6.74%$1.11
-0.02%$2,988.36
-7.52%$0.999542
-0.03%$32.83
-2.10%$1.024
0.02%$0.00000821
-6.30%$0.03691268
-4.01%$1.11
0.02%$114.12
0.01%$53.91
-9.04%$84,159.00
-5.27%$1.90
-10.17%$84,295.00
-5.23%$0.099679
-6.46%$1.21
-0.97%$84,880.00
-5.45%$0.201827
-4.85%$2,990.79
-6.69%$1.25
0.16%$0.999544
-0.04%$3,006.95
-6.72%$2,811.69
-6.74%$0.999464
-0.04%$1.25
-4.11%$1.79
-6.07%$0.078271
-0.74%$0.01024696
-4.47%$1.80
-5.90%$136.50
-6.44%$0.99714
-0.06%$0.00916106
-8.91%$2,811.21
-6.67%$0.510741
-5.76%$1.093
0.01%$0.270555
-9.77%$0.780668
-7.38%$0.99898
-0.01%$0.01297493
-0.88%$0.115792
-5.79%$0.284386
-5.25%$84,107.00
-5.53%$0.997514
-0.08%$0.21355
-6.22%$0.02710623
13.70%$0.329423
-6.60%$0.04690092
-18.57%$2,812.27
-6.67%$1.089
-0.01%$0.997101
-0.16%$87,884.00
0.00%$116.14
-0.41%$0.120734
-4.77%$3,024.34
-6.74%$1.12
0.02%$173.83
0.73%$1.20
0.07%$4.10
-8.09%$1.64
-12.26%$2.02
0.36%$0.999312
-0.01%$0.480351
-7.96%$1.00
-0.11%$3,151.75
-6.74%$1.13
0.03%$158.57
-6.62%$0.572781
-7.52%$0.343567
-2.10%$0.430713
-7.64%$0.04414436
-1.22%$3,034.62
-6.67%$0.00000039
-3.29%$84,552.00
-4.35%$0.00003917
-6.17%$2.23
-7.37%$0.03408906
-5.12%$0.01888427
4.82%$145.42
-8.81%$0.413609
-9.26%$134.65
-4.91%$0.00000036
2.87%$0.06109
-5.56%$0.838887
-4.71%$0.081761
-4.78%$17.17
-4.03%$0.058248
-14.03%$1.019
2.70%$0.167815
-6.95%$0.063544
-8.43%$0.063582
-6.22%$0.9988
-0.07%$0.00339589
-6.86%$8.36
-7.38%$20.41
-1.75%$84,153.00
-5.45%$0.00642691
-6.43%$0.34058
-10.01%$1.93
-3.92%$17.92
-4.15%$0.114905
-6.93%$0.999378
-0.06%$0.300995
-23.56%$0.116256
-7.14%$2,779.96
-7.95%$0.293969
-8.09%$0.996721
-0.21%$0.28606
-2.78%$2.29
-0.22%$0.00282117
-1.84%$0.128161
-12.27%$84,196.00
-5.42%$0.984363
-0.81%$0.14876
3.53%$0.267342
-11.34%$84,170.00
-5.68%$914.31
-4.28%$1.066
2.73%$0.00268315
-2.88%$0.00552569
-7.32%$0.142098
-2.11%$1.065
-0.12%$84,706.00
-5.26%$0.93722
-7.77%$2,810.58
-6.71%$13.75
-8.39%$0.249437
-6.57%$0.02528145
-7.92%$0.03416938
35.52%$1.53
-1.48%$3,053.91
-6.67%$84,177.00
-5.15%$32.51
-1.98%$22.02
-0.16%$0.00652759
-3.87%$0.125838
-7.37%$2.46
13.37%$3.35
-5.29%$2,808.95
-6.68%$0.15538
-9.97%$0.061341
-9.29%$2,804.64
-6.63%$3,445.70
-6.73%
Ethereum is on fire.
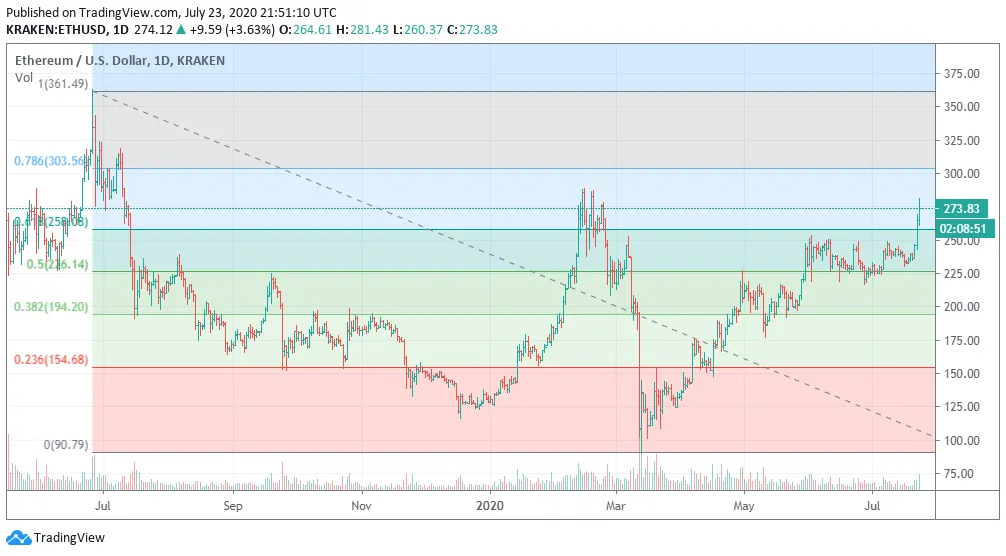
After breaking through the $240 resistance level that kept it trading sideways since June, the most important altcoin in crypto changed the course of an otherwise “boring” few months of trading.
ETH jumped following a sudden rise in the price of Bitcoin on Wednesday night. And it hasn’t stopped since. When Bitcoin broke above $9,300, the rest of the crypto market followed. Total market capitalization for all of crypto grew by roughly $7 billion in 24 hours.
Now, the yearly record band is the new barrier to overcome. ETH last struck $285 per token in mid February. If Ethereum manages to stay above $285 after the correction, we could soon see ETH in the $300-315 range again.

But there’s more to Ethereum’s growth as of late than what traders see in the charts. Its fundamentals are in good shape, considering the exponential growth of DeFi protocols designed for borrowing, lending and peer-to-peer trading. In crypto, 2020 has very much been the “year of DeFi.”
Likewise, stablecoins have also increased in popularity and volume. Tether, or USDT, overtook XRP earlier this year to enter into the top three of cryptocurrencies by market cap. Indeed, Ethereum now moves more value on a daily basis than Bitcoin precisely because it’s become the blockchain of choice for the exchange of stablecoins.
But not everything is rosy in the world of Ethereum. The growing popularity and use of DeFi protocols and associated tokens is both a blessing and a curse. The Ethereum network is currently dangerously close to reaching its technical limits, as DeFi and Tether are essentially responsible for as many transactions as the network can handle at the moment.
Will it collapse under the weight of its own success, or will Ethereum 2.0 arrive in time?
Place your bets.
Disclaimer
The views and opinions expressed by the author are for informational purposes only and do not constitute financial, investment, or other advice.
