Bitcoin Price Prints Highest Three-Week Close Ever
An unstable global economy, fears of inflation, and institutional investors warming up to cryptocurrencies have pushed Bitcoin prices to record closes.
Add Decrypt as your preferred source to see more of our stories on Google.
The Bitcoin price set a new record this week as the pioneer cryptocurrency posted the highest ever three-week close in its 12-year history, data shows.
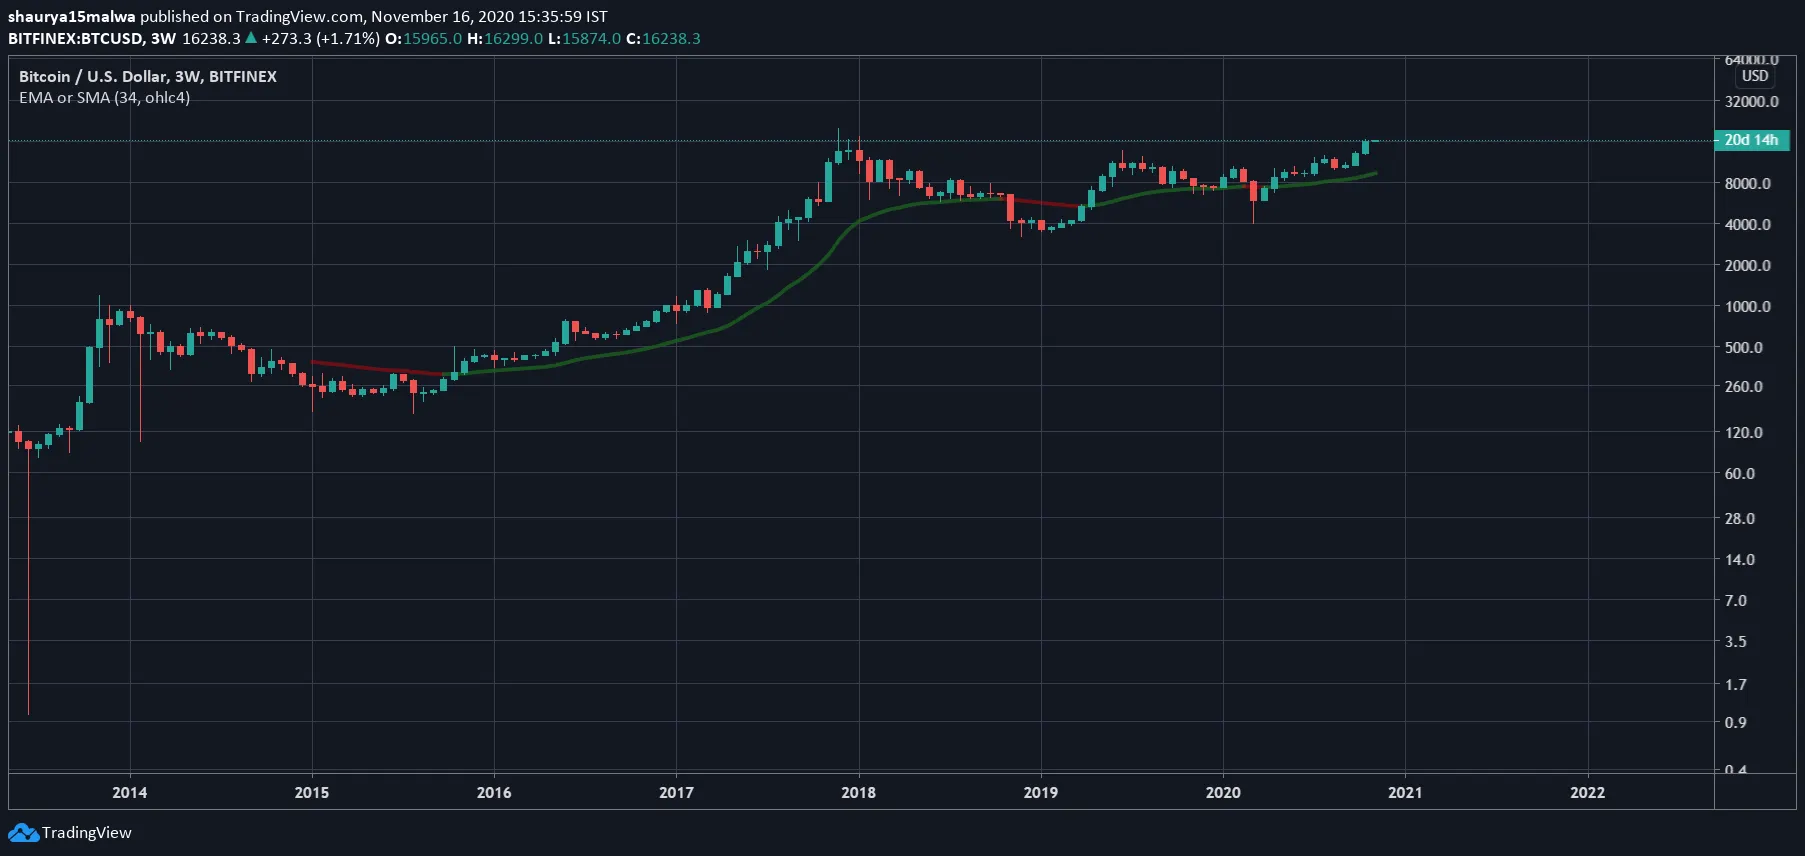
Weekly candles, such as the ones on the chart below, are a calculation of the price moves made by a financial asset (Bitcoin in this case) in a seven-day period. The open is the bottom part of the candle where an asset started to trade (excluding the thin lines that are price wicks), while the close is the last price paid by traders and investors for that asset in that period.
Bitcoin closed at its highest tri-weekly price in its 12-year history. Image: BTC/USD on TradingView
While Bitcoin reached its highest price of nearly $20,000 in the first week of December 2017, its weekly chart closed much lower at $13,500. This price behavior indicated that—at the time—the open market considered Bitcoin to be highly overvalued and the $20,000 price a mere wick in the longer-term outlook, with the tri-weekly charts moving in a downtrend from then until February 2019.
But the scenario has since changed, and the market is now accepting a higher price for Bitcoin. The latest tri-weekly candle for the asset closed at $15,960—an 18% increase—showing that the market is now valuing Bitcoin much higher than it did in 2017.
Some factors behind this are the bleak sentiment for fiat currencies and the fear of inflation as a result of quantitative easing, with some investors, such as hedge fund manager Paul Tudor Jones and software firm MicroStrategy, turning to Bitcoin to protect their coffers.
Bitcoin, amidst all that, has emerged as a relatively stable and decentralized store of value that is not governed by any particular country or subject to political policies. Microstrategy CEO Michael Saylor—who personally holds 17,732 Bitcoin—enumerated such qualities of Bitcoin as an investment in a tweet last week:
#Bitcoin is not a currency, nor is it a payment network. It is a bank in cyberspace, run by incorruptible software, offering a global, affordable, simple, & secure savings account to billions of people that don’t have the option or desire to run their own hedge fund.