In brief
- Bitcoin is largely framed as a "safe haven" asset that isn't correlated with the stock market.
- Between 2018 and 2020, BTC actually demonstrated correlation with the world's largest stock index, and this correlation reached its eight-year peak in 2020.
- In 2021, Bitcoin has slowly decoupled from the stock market, and may now be forming an inverse correlation.
When investors dumped stocks this week in response to rising U.S. inflation, the price of Bitcoin tumbled too. This is notable since many Bitcoin boosters frame it as an asset that defies the movement of traditional markets — bursting upwards for much of its existence despite the ebbs and flows of the stock market.
It's too soon to say whether this week's sell-off undercuts the thesis that Bitcoin is a hedge against inflation. It is after all just one data point, and veteran market watchers caution against drawing conclusions from single-day events.
That said, people are right to ask if Bitcoin's distinct properties as a deflationary asset mean that it will eventually break away from whatever correlation it has with traditional markets—or if people will flee from it as they do from other speculative assets in times of market turmoil.
Let's turn to the data.
The Last Three Years: Bitcoin and stocks were correlated
Decrypt is using the largest and most widely followed stock index, the Standard & Poor's (S&P) 500 index — which tracks the 500 largest companies by market capitalization listed on U.S. stock exchanges — to assess the degree to which Bitcoin is correlated to the stock market.
One of the simplest ways to measure the correlation is to see how Bitcoin reacts when the stock market experiences a wild price swing one way or the other.
In the last three years, the S&P 500 has experienced three dips of at least 10% or more. From peak to trough, the first was a 10% dip between January and March 2018; the second a 17.3% dip between September and December 2018; and the largest was a whopping 31.7% crash between February and March 2020.
What was Bitcoin doing during those stock dips? As it turns out, it was moving in a similar fashion each time, albeit with a far more severe trajectory. Overall, during the periods where the S&P 500 suffered its three largest losses, Bitcoin experienced a 31.5%, 51.6%, and 47.2% crash respectively. That last dip occurred following what is now known as "Black Thursday 2020" — a historic crash that coincided with the start of widespread COVID-19 lockdowns.
These crashes were the largest for the cryptocurrency market overall during the period measured — that is, Bitcoin's three largest drops of the past three years coincided with the three largest stock market drops.
Curiously, Bitcoin began its descent hours or sometimes days before the S&P 500 began moving each time, making it somewhat of a leading indicator for the stock market. This may be explained by the increased volatility of the Bitcoin market, and the heavy use by crypto traders of stop losses or take profit orders (automated instructions to buy or sell that can cause a cascade) when the market jerks one way or the other.
Now, what about when times are good?
It appears there is also a slight correlation between Bitcoin bumps and broader stock market surges over the last three years. This is underscored by the fact both have been on an overall uptrend over the last three years, but also that they are moving even closer in lock-step as time goes on.
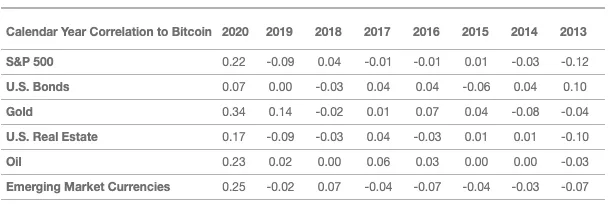
According to data by VanEck, in the last three years, Bitcoin has gone from being positively correlated with the S&P 500 in 2018 (0.04), to negatively correlated in 2019 (-0.09), and finally back to positively correlated in 2020 (0.22). The correlation coefficient is usually given as a number between -1 and 1, so the closer it is to -1, the stronger the negative correlation (i.e. the two variables tend to move in opposite directions), and the closer to 1, the stronger the positive correlation (the two variables tend to move in the same direction).
2020 was the most correlated Bitcoin has ever been to the S&P 500:

Although we can say that Bitcoin has been generally positively correlated with the stock market in recent years, it's not a very high correlation. In fact, Bitcoin is more correlated with gold — another safe-haven asset.
But Bitcoin and the S&P 500 don't always move in lockstep. Bitcoin has made several sharp bullish moves in the last three years, while the S&P 500 has remained roughly flat or even declined. One notable example occurred between April and May 2019, when Bitcoin posted a 69% gain in a month, while the S&P 500 fell by 7% that month. This came at a time when Fidelity Investments announced its cryptocurrency trading platform, and leading cryptocurrency exchange Binance suffered a $40 million hack.
Leaving aside these outlier examples, the broader trend remains that the correlation between Bitcoin and the S&P 500 has increased slightly during the last three years. There is no definitive explanation for why this is the case, but one likely reason is growing Bitcoin adoption by retail and institutional investors—many of whom have positions in both the stock and crypto markets.
Overall, Bitcoin and the S&P 500 were weakly correlated between 2018 and 2020.
2021 So Far: Bitcoin correlation to stocks waning
While Bitcoin demonstrated a clear correlation (though weak) with the stock markets in previous years, this dropped off towards the end of 2020 and the correlation fell below 0.2 at the start of 2021.
Since the start of this year, both Bitcoin and the S&P 500 have been on a strong uptrend as the U.S. economy climbs out of the pandemic, and both hit an all-time in the last six weeks. However, while BTC has doubled in value since the start of the year, the S&P 500 index has only improved by 8.5% over the same period.
The two markets have moved out of sync during this time, with Bitcoin experiencing multiple sudden burns upwards, while the S&P 500 barely moved. Meanwhile, Bitcoin has also been hit with sudden downward shocks, most notably after Elon Musk's tweet this week that Tesla would stop accepting Bitcoin.
As a result, the realized correlation between the two markets has been on the downtick since December 2020, and fell below zero, back to negative, in March 2021. This is the first time it has been below 0 since January 2020.
This could indicate that Bitcoin is gradually decoupling from the stock market, and may instead be forming an inverse correlation with it (when stocks move in one direction, Bitcoin goes the other way). For this to be validated, Bitcoin would need to continue moving away from the S&P 500 in the coming months.

