Disclaimer
The views and opinions expressed by the author are for informational purposes only and do not constitute financial, investment, or other advice.
$67,070.00
-1.37%$1,968.13
-1.04%$1.46
0.53%$610.84
-1.95%$0.999999
0.01%$82.59
-2.91%$0.279829
-0.39%$0.099784
-0.39%$1.031
1.36%$556.09
-1.16%$51.11
-0.68%$0.280464
-0.84%$0.999449
-0.05%$8.47
-2.45%$29.07
-2.12%$0.167224
0.95%$0.999412
0.03%$334.31
0.62%$8.69
-1.89%$0.164998
-0.92%$0.999808
-0.01%$0.00983295
-3.24%$279.88
-4.39%$0.100285
-0.43%$53.72
-2.22%$0.999844
-0.02%$8.99
-2.30%$0.00000641
-1.89%$0.950668
-2.61%$1.44
0.73%$0.127055
25.80%$0.079036
-0.46%$1.50
-1.91%$4,939.37
1.27%$4,961.02
1.25%$1.34
-2.23%$3.52
-0.91%$0.627194
-2.09%$125.56
-2.11%$1.00
0.00%$188.77
-2.37%$0.00000432
-1.74%$0.997065
-0.12%$0.707351
-0.62%$0.184782
3.79%$78.39
-2.16%$2.35
-1.01%$1.00
0.03%$1.12
0.00%$0.0000017
-0.28%$0.999999
0.02%$0.065995
-3.96%$8.58
-1.58%$1.034
-2.31%$0.270685
-2.14%$0.998802
-0.04%$2.32
-3.46%$10.99
0.04%$0.00208807
-5.35%$2.37
3.62%$0.109154
2.31%$7.12
-2.25%$0.02041709
19.13%$8.37
-0.35%$0.385102
-2.86%$68.89
0.03%$0.058564
4.90%$0.117824
-2.46%$0.875459
-3.74%$0.03184102
0.14%$0.999561
-0.03%$0.092325
-2.01%$0.00961506
0.43%$3.52
2.59%$1.46
4.69%$1.24
0.02%$1.44
-0.53%$0.03672569
-0.72%$1.027
0.00%$114.32
0.03%$0.948088
-2.48%$0.999476
-0.02%$1.11
0.22%$0.886908
-5.36%$0.00798874
-1.73%$0.11052
-3.10%$0.080299
0.03%$0.996181
0.01%$1.095
0.00%$0.559752
4.82%$0.00000638
-2.21%$0.999776
0.00%$0.02897516
12.92%$1.00
-0.03%$0.16073
-3.15%$0.01287561
-0.30%$0.073884
-1.00%$0.997462
-0.03%$1.089
0.28%$36.93
-2.43%$0.257224
-1.36%$1.18
0.00%$0.0069858
-2.40%$1.29
-1.73%$0.392696
-0.70%$0.639234
-2.80%$0.230219
12.21%$0.04009818
-0.97%$22.92
-0.60%$0.998702
-0.03%$1.12
-2.77%$0.18393
-2.44%$0.16979
-0.87%$1.54
-3.10%$158.99
1.54%$0.04288652
0.21%$0.249672
-1.55%$0.083527
-1.14%$0.470978
-2.49%$0.00000034
-1.94%$0.00000034
-0.66%$16.75
-0.39%$0.05664
-1.60%$0.01703958
-2.85%$0.177872
-9.91%$0.999801
0.00%$0.345848
6.15%$0.055808
-0.70%$121.20
-6.67%$1.55
-4.86%$1.02
0.01%$3.08
-1.99%$0.00003136
-1.63%$0.336718
-1.46%$0.068236
-2.17%$3.01
0.82%$0.00592082
-4.68%$0.02723283
-2.54%$0.999128
0.23%$0.31459
-1.37%$0.335524
-2.23%$0.243707
-2.18%$0.053731
-0.91%$1.48
5.76%$0.988267
-0.35%$17.22
-0.31%$0.07674
-2.16%$0.00274598
-0.13%$0.04765214
-1.88%$6.78
0.77%$0.0025417
-0.39%$1.32
-9.93%$0.02144943
-2.07%$1.51
0.88%$0.555938
-0.74%$0.085834
-0.24%$0.999736
-0.06%$0.226553
-3.55%$5,975.46
3.38%$1.33
-2.28%$0.02034992
-8.50%$1.00
0.00%$1.075
0.01%$0.983754
-0.44%$0.999759
-0.00%$22.86
2.65%$0.09525
-2.80%$0.0020785
1.82%$0.200389
-3.40%$1.21
-1.10%$0.00000095
-1.55%$0.101629
9.19%$2.77
-1.50%$0.00522959
-2.85%$0.1003
-0.72%$0.192156
-1.40%$0.081373
1.93%$2.07
2.83%$1.00
0.00%$0.126472
-1.99%$0.00398855
-2.33%$0.191006
-1.09%$0.052207
-1.01%$0.000034
-0.54%$1.001
-0.01%$9.76
-18.67%$1.45
-2.48%$0.04760067
-2.23%$4.09
-2.27%$0.179186
-3.21%$1.00
0.00%$0.660098
-1.94%$2.21
-0.76%$18.10
-6.93%$0.766192
-4.51%$2.19
-4.61%$15.16
-9.71%$0.052957
-0.99%$1.80
0.01%$0.0225593
2.46%$47.98
0.01%$0.00000803
-2.28%$1.013
0.00%$1.27
-0.07%$0.998097
0.01%$0.972916
-2.15%$0.213261
-1.46%$0.334732
1.56%$0.999367
0.08%$0.998255
-0.07%$0.310534
0.26%$0.966804
-1.95%$1.80
5.74%$0.164909
-2.35%$0.397848
-1.95%$0.647702
-3.05%$0.084271
-1.41%$9.02
1.41%$0.136522
-3.19%$0.272842
-0.09%$0.3108
-10.47%$4.58
-2.37%$0.133323
7.83%$0.622587
-8.14%$0.082698
-2.87%$0.093932
-1.44%$2.02
-0.83%$0.322814
0.03%$0.00153338
-1.69%$1,097.87
0.08%$0.262544
-2.48%$0.073142
-6.63%$0.00414959
-0.74%$0.372584
-3.16%$0.994867
-0.03%$0.130706
-0.11%$0.204103
-3.00%$1.058
0.03%$1.001
0.00%$0.00233928
-3.08%$2.40
-4.01%$0.118313
18.90%$0.207921
-2.84%$0.122763
2.37%$0.113443
-1.50%$0.02028106
-5.06%$0.02892756
-9.36%$0.12434
-2.94%
If you thought Bitcoin investors were having a rough day, you might want to avoid looking at the Ethereum charts.
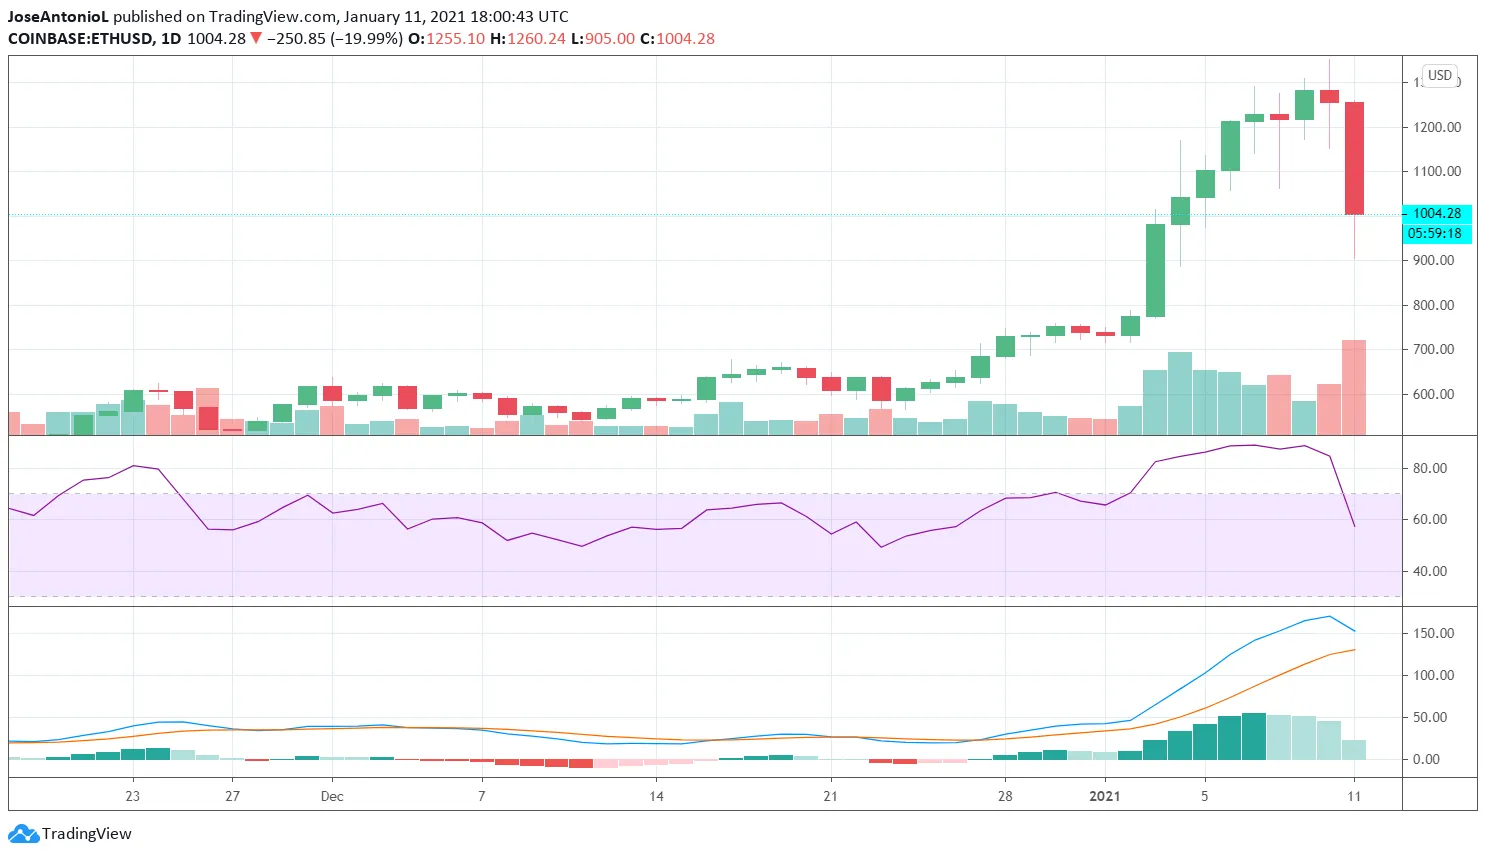
In less than 24 hours, the largest altcoin in the crypto market went from $1,255 to $905, cancelling all the gains of the previous week.

Ethereum, like most altcoins, is heavily correlated with Bitcoin. Today’s price crash illustrates what happens to the rest of the market when Bitcoin drops—just like last week showed what happens to other crypto assets when Bitcoin is rallying.
In US dollar terms, this is the second-largest red candle for Ethereum ever. (That is to say its second biggest drop in price within 24 hours.) ETH’s worst day came on January 16, 2018, when the coin dropped from $1285 to $852 in 24 hours… only to keep bleeding all the way down to the $300 price zone before a bullish correction.
Ethereum, like Bitcoin, had been on an epic run over the last couple weeks—with Bitcoin hitting new all-time high after new all-time high.
At the moment, though, market indicators suggest a trend reversal for ETH. Its relative strength index—a metric that evaluates the balance of buyers and sellers in a market—suggests a panic episode among traders: it’s dropped from 88 (extremely overbought) to 56 (much more balanced levels) in just hours, which is one of its steepest falls in months.
Today’s dip just goes to show how quickly things can change in crypto. In fact, as we wrote this, Ethereum has since recovered a bit and is now trading for just above $1,000—now only down 20% on the day.
Disclaimer
The views and opinions expressed by the author are for informational purposes only and do not constitute financial, investment, or other advice.
