
In brief
Disclaimer
The views and opinions expressed by the author are for informational purposes only and do not constitute financial, investment, or other advice.
$119,774.00
1.80%$3,003.63
1.78%$2.89
4.44%$693.00
0.81%$165.02
2.35%$0.999902
0.00%$0.20161
1.92%$0.301004
-0.50%$3,003.47
1.81%$0.756063
5.26%$49.31
4.15%$0.506882
22.28%$119,491.00
1.78%$3.77
10.43%$3,556.52
-0.31%$15.89
5.00%$0.252986
26.09%$508.21
0.23%$21.67
3.11%$9.03
-0.48%$3,218.35
1.73%$0.00001353
2.46%$3,002.83
1.74%$3.00
-0.38%$95.80
2.64%$0.999838
0.01%$46.22
0.33%$342.22
3.57%$0.999968
0.05%$4.09
4.46%$119,680.00
1.59%$1.00
0.04%$0.00001266
2.83%$4.47
2.01%$8.70
2.77%$315.94
4.85%$400.19
4.20%$0.467405
0.42%$5.12
6.09%$0.106976
6.01%$2.61
5.07%$1.18
0.15%$5.58
4.27%$49.09
0.72%$0.923324
5.20%$200.67
2.41%$18.70
2.74%$1.00
0.00%$0.280621
27.03%$0.701399
7.67%$0.087991
4.79%$0.351946
9.02%$1.059
-0.02%$0.999807
0.05%$4.77
3.81%$0.02517673
5.77%$0.236775
4.07%$0.00002713
6.32%$0.4194
4.50%$3.84
5.72%$9.68
1.10%$4.48
-0.34%$0.734602
5.43%$0.341437
6.74%$15.87
-1.53%$1.072
4.24%$0.02904378
26.68%$3,002.46
1.82%$2.61
3.16%$119,850.00
2.15%$119.59
6.26%$0.078908
1.00%$175.13
2.32%$4.77
1.26%$0.517979
8.69%$1.62
7.16%$11.46
0.78%$0.999305
-0.08%$0.99992
0.02%$3,151.01
1.88%$3,425.18
1.85%$1.94
4.56%$1.36
6.44%$1.001
0.10%$0.08185
16.00%$1.29
1.39%$4.34
-2.32%$0.815973
9.14%$12.73
3.10%$0.01720745
2.21%$0.368768
5.90%$0.672028
4.06%$1.77
3.05%$3,218.60
2.11%$3,159.64
1.92%$1.00
-0.00%$1.022
5.57%$0.540189
5.66%$3,167.75
1.76%$0.101405
5.04%$0.999737
0.00%$119,611.00
1.85%$119,530.00
1.76%$0.00009855
0.58%$3,348.76
-0.08%$0.593708
0.63%$1.11
0.01%$0.679847
10.12%$692.73
0.80%$0.15694
0.79%$11.45
-2.33%$118,497.00
-0.29%$3,244.21
1.73%$0.999354
-0.02%$0.225545
17.90%$0.553489
4.55%$184.99
2.19%$2.42
3.34%$0.827739
5.58%$3,353.56
0.04%$215.41
2.33%$0.01784535
6.90%$0.01635122
9.75%$0.318017
11.00%$0.859438
6.75%$2.85
7.67%$0.00000195
16.13%$22.49
4.01%$10.74
0.00%$0.842537
9.24%$111.77
0.00%$0.12181
4.34%$43.32
2.98%$1.96
3.42%$0.649045
4.49%$0.00000068
1.16%$0.99827
0.03%$3,002.20
1.74%$0.254516
1.11%$49.36
4.27%$4.00
3.52%$3,216.45
2.15%$1.095
0.43%$0.394834
4.49%$3,134.41
2.39%$119,525.00
1.83%$3,003.46
1.67%$117,543.00
1.00%$0.324424
5.79%$1.93
15.50%$0.999539
-0.00%$0.01730114
5.06%$0.00876624
-0.08%$0.997534
-0.00%$3.16
2.92%$0.412607
3.52%$0.057546
5.93%$119,644.00
1.70%$0.520994
5.41%$0.558604
4.19%$49.32
4.23%$1.56
5.28%$0.671003
3.16%$0.104907
8.46%$26.62
1.48%$1.00
0.01%$0.99958
-0.05%$0.200964
1.62%$3,006.47
1.80%$0.142091
4.60%$0.99845
-0.03%$0.00533209
18.45%$0.498466
-4.64%$0.00818931
5.65%$0.436476
3.87%$3,190.00
1.50%$0.221696
-0.82%$0.00461108
2.73%$0.612568
2.88%$7.04
12.95%$0.183589
10.82%$6.45
4.36%$0.999902
0.00%$15.82
3.66%$0.376608
5.59%$0.062486
-0.97%$0.00000045
-0.14%$47.34
1.12%$1.18
4.73%$0.314432
-14.63%$3,311.41
1.70%$7.55
-0.86%$1.37
5.18%$0.00002145
2.51%$2.55
3.72%$119,878.00
2.05%$1.094
0.00%$0.056938
6.13%$0.996922
-1.37%$0.04139795
4.23%$3,288.36
1.75%$0.55091
4.02%$0.151159
0.10%$1.001
0.32%$0.083506
6.28%$0.395437
9.82%$2,998.64
1.56%$3,002.78
1.73%$0.824222
9.30%$1.00
0.01%$1.53
-0.57%$0.365931
4.95%$1.32
-2.72%$2,992.32
1.55%$0.03650845
0.25%$0.00689694
2.37%$119,463.00
1.75%$0.887845
6.25%$0.01869697
-0.64%$1.00
0.03%$180.49
2.60%$0.00006393
2.79%$0.527895
2.28%$21.12
-0.19%$0.236875
4.30%$0.74352
11.14%$129.09
1.58%$26.33
3.16%$0.558389
17.76%$1.15
3.42%$11.47
1.10%$3,625.20
1.76%$21.68
3.21%$0.00463551
11.70%$0.02999789
4.90%$0.0037844
3.16%$0.763843
2.35%$0.999361
0.02%$0.999774
0.06%$0.999345
0.03%$0.312091
9.72%$119,695.00
1.88%$3.66
17.45%$0.999649
-0.05%$2,404.48
1.80%$3,151.17
1.73%$1.02
0.00%$17.17
1.05%Reading
The Ethereum ecosystem in 2020 has witnessed a DeFi explosion that has helped push the price of ETH up while launching potentially profitable new tokens. But now traders have to ask: What to do with all that ETH now that its price is going up and DeFi protocols have come back to life?
Their answer: Just keep doing the same thing.
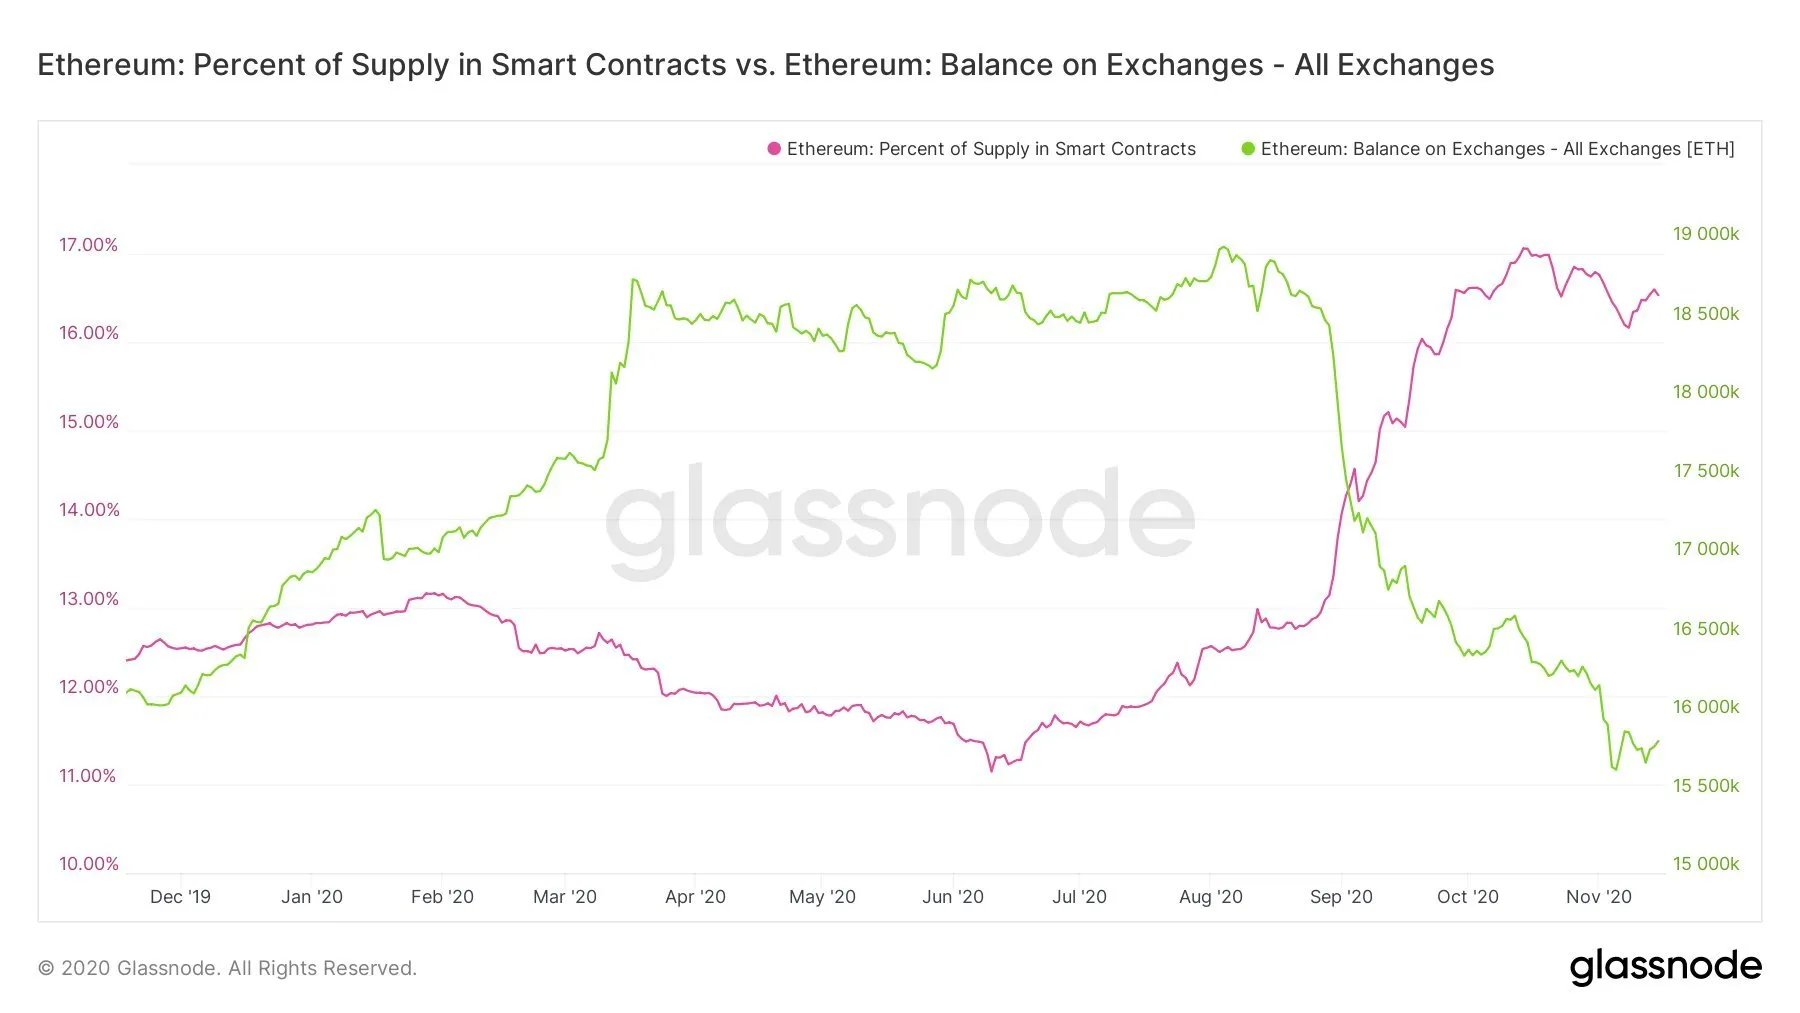
According to Glassnode data, the amount of Ethereum held in exchanges has been declining since the end of July 2020. Meanwhile, the percentage of Ethereum deposited in smart contracts, where it can potentially generate interest in DeFi protocols, has been rising since June.
In the course of a few months, the supply of ETH sitting in smart contracts went from 11% to 17%, whereas the ETH in exchanges went from 19,000 ETH to 15,500.
Until last month, that is. October showed a slight variation: While ETH continued to leave the centralized exchanges, the number of deposits to smart contracts remained relatively stable; DeFi stopped growing.
Pedro Febrero, the founder of Bityond and researcher at Quantum Economics, told Decrypt, "What I suspect is happening is the same thing that is going on with Bitcoin: essentially, we're noticing a growing number of coins being taken out of exchanges into private wallets.”
He continued: “Most likely, these entities have no interest in selling in the short-term."
This, of course, impacts the markets since a decrease in supply can generate an increase in prices—as there is more competition among buyers. That’s what Chainalysis reported today is happening with Bitcoin.
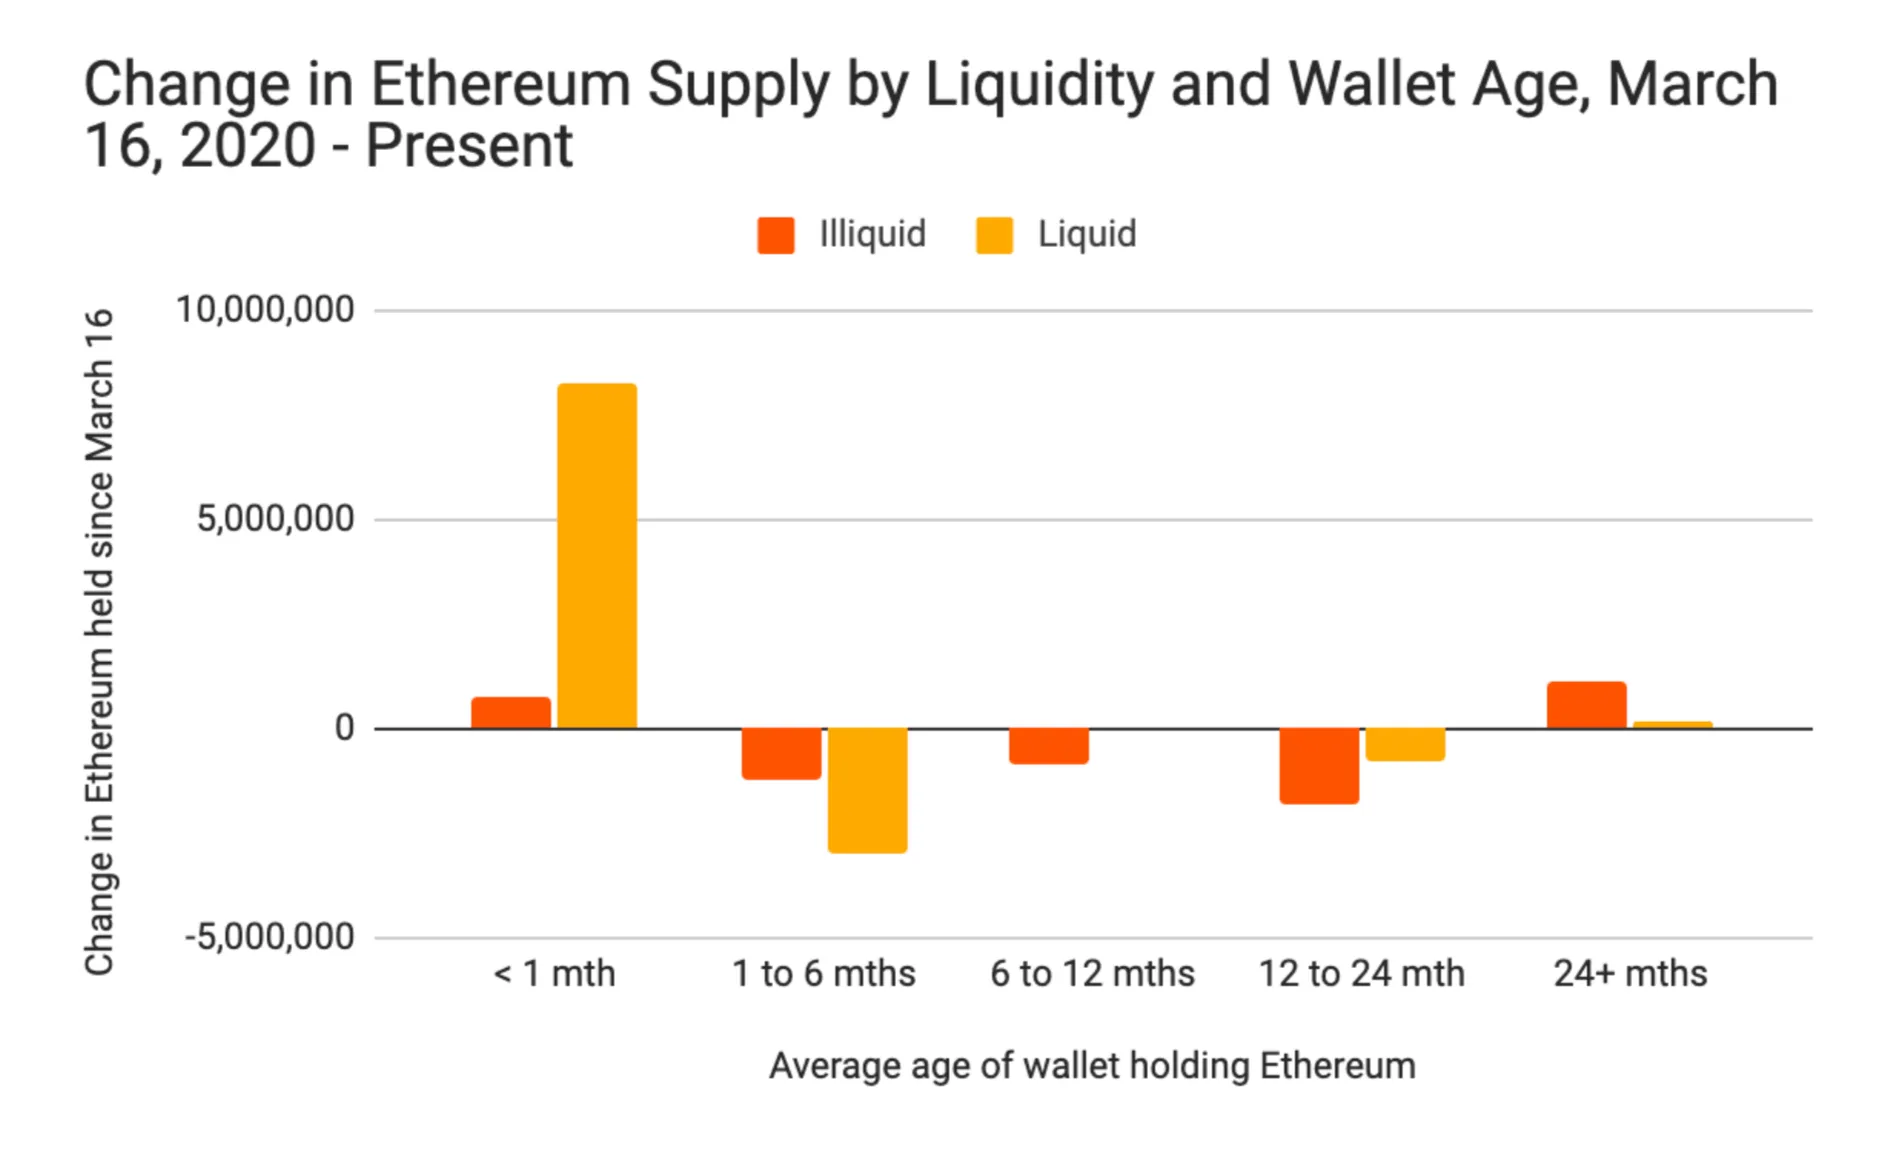
But it’s not quite to the same degree. That’s because, while the percentage of ETH in smart contracts has plateaued, it’s still near all-time highs. According to Chainalysis, “Ethereum...is becoming more liquid, moving into wallets that not only trade frequently, but that are also quite new.”
In the last eight months, it said, “over 8 million ETH moved into liquid wallets less than one month old at the time of acquisition.”
Of course, traders may just be letting their ETH settle into DeFi smart contract long-term. Regardless, with the price of Ether reaching levels not seen since 2018, holders are fine with taking a break as long as the price keeps rising.
Disclaimer
The views and opinions expressed by the author are for informational purposes only and do not constitute financial, investment, or other advice.
Stablecoin issuer Tether is ending its USDT support for five blockchains effective on September 1, the company announced on Friday, ending redemptions and freezing the remaining assets on those blockchains. Last June, the firm ended its minting function on Algorand and EOS (now called Vaulta), meaning it would no longer issue new stablecoins on those chains. In 2023, it announced the same for Bitcoin Cash, Kusama, and Omni Layer Protocol. Now, Tether has put a hard end date on its stablecoin s...

Solana token launchpad Pump.fun is prepping for its initial coin offering, aka ICO, on Saturday, July 12. With U.S. and UK citizens banned from participating, traders are eagerly awaiting its full launch to purchase PUMP—but will it pump or dump once it starts trading? The token is set to go on sale via six centralized exchanges (Bybit, Kraken, Bitget, MEXC, KuCoin, and Gate.io) as well as the Pump.fun website Saturday, with 150 billion tokens up for grabs at $0.004 each. Within 48 to 72 hours a...
U.S. spot Bitcoin exchange-traded funds pulled in over $1.17 billion on Thursday, notching their second-highest day of inflows ever as institutional capital flooded into digital assets. The massive inflows to Bitcoin ETFs were led by BlackRock's IBIT with $448.5 million, followed by Fidelity's FBTC at $324.3 million and ARK's ARKB with $268.7 million, according to Farside Investors data. Even with $40.2 million in outflows from Grayscale’s GBTC, total net flows turned sharply positive. The infl...