Add Decrypt as your preferred source to see more of our stories on Google.
In a significant leap for decentralized exchanges (DEX), dYdX has now clinched the title of the largest DEX by daily trading volume, surpassing Uniswap v3 on Ethereum. This milestone follows a strategic migration from Ethereum to Cosmos and the subsequent activation of full trading under the new infrastructure.
According to data from CoinMarketCap, the v4 version of dYdX on Cosmos recorded $542.5 million in trading volume over a 24-hour period, outpacing Uniswap v3's $464 million. The DEX now holds 10.7% of all the crypto market share.
The official dYdX account celebrated the achievement on CoinMarketCap’s community platform while showing data from January 16, the day when the DEX recorded $761 million in total daily volume—much more than Uniswap’s $529 million.
The shift continues a recent trend of decentralized exchanges on platforms other than Ethereum topping the long-dominant chain. Solana DEX volume collectively topped that of Ethereum in December as Solana-based meme coins surged, thanks to lower fees on the network.
On December 21, trading on Solana's Raydium beat that of Uniswap's Ethereum DEX, per data from DeFi Llama, though all of Uniswap' DEX volume across numerous chains and scaling networks collectively beat Raydium's Solana tally.
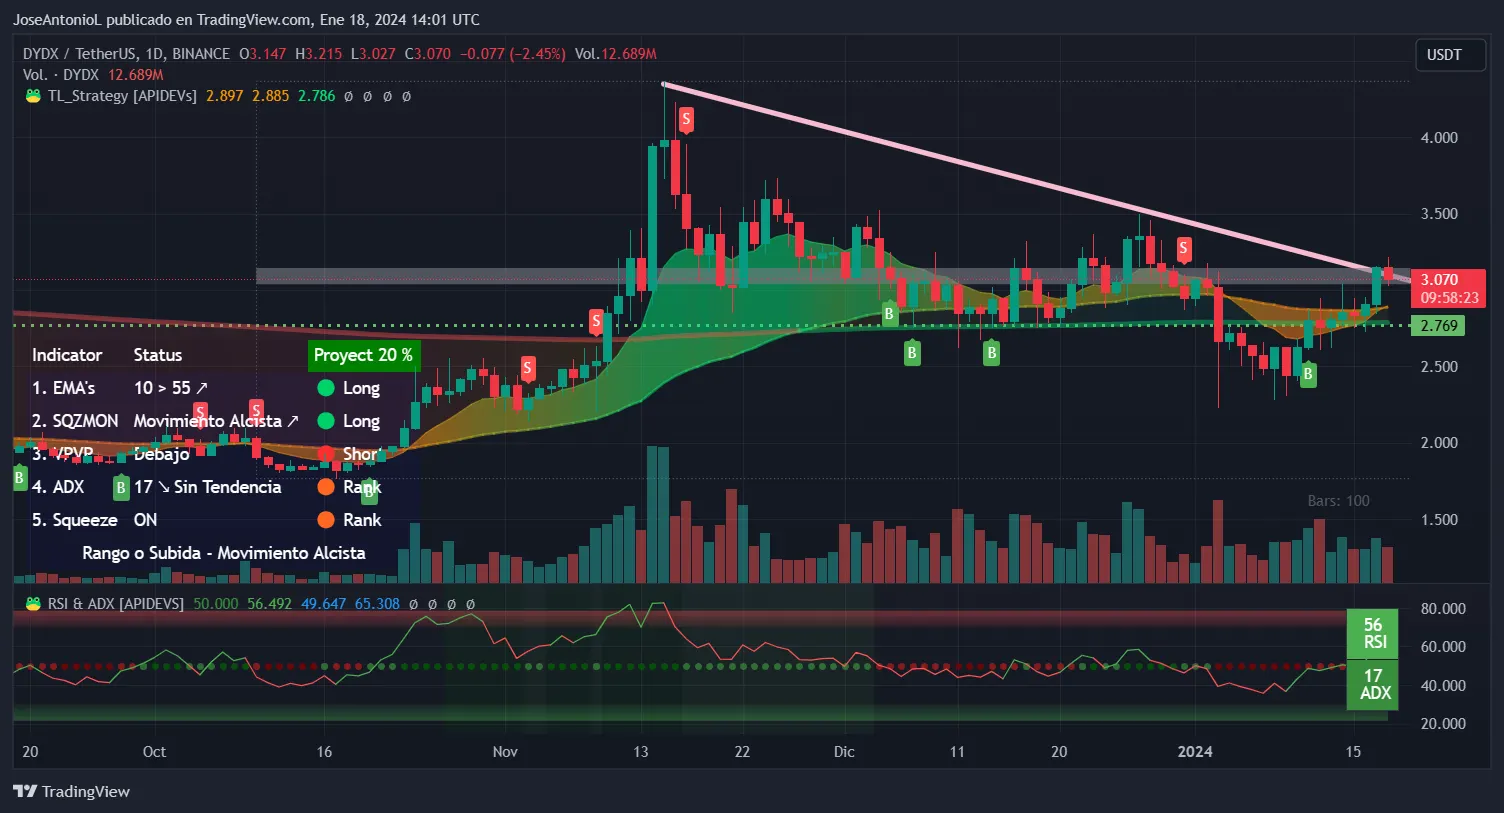
Currently dYdX is sitting at around $3.015, a 4.3% retracement from the $3.14 recorded yesterday, and slightly below the price resistance set at around $3.10.
The surge in dYdX's prominence is also reflected in its price trend. The exponential moving average (EMA) suggests that the token may be about to reverse a price correction if it can break a trend resistance.
🎉 New milestone achieved! dYdX Chain has officially hit $1 Billion in 24-hour trading volume on January 12!
🔝 👀 Most traded pair? ETH/USDC with $412M.
A heartfelt thank you to our community for making this possible. Onward to the next billion! 🫶 pic.twitter.com/EznBiL1QZN
EMAs are used to smooth out the price data over a specified period to identify the trend direction. When a shorter period EMA—like the 10-day EMA, which is basically the average price of the last 10 days—crosses above a longer period EMA (like the 55-day mark), it is considered a bullish signal. This type of crossover suggests that recent prices are higher than older prices, indicating a potential trend reversal or the start of an uptrend.
The movement, however, is not a strong one. The peak volume price (PVP) points to a short position, indicating resistance, while the low average directional index (ADX) suggests a lack of a strong market trend.
The squeeze momentum indicator, which points to potential shifts in market trends, signals a buildup of momentum, hinting at a possible breakout but not really a strong spike. The relative strength index (RSI) hovers around 56%, indicating a balanced market state with no notable dominance of bulls or bears.
Image: Tradingview
Based on these indicators, the dYdX token may continue to consolidate within its current pattern, with potential breakouts indicating further growth. The precise prediction, however, remains subject to market dynamics.
Based on the current technical indicators and the chart pattern, the dYdX price may continue to consolidate within the triangle pattern. A breakout above the downtrend line could signal a move towards the upper resistance levels, potentially around the $3.50 mark. Conversely, a breakdown below the EMA support could see prices testing lower supports, near the $2.50 level. Right now it’s at $3.015 so trading with caution is advised, especially for scalpers and day traders.