
In brief
$63,921.00
0.86%$1,841.77
-0.14%$567.58
-0.46%$0.999891
0.01%$1.089
0.27%$75.27
0.61%$0.322567
0.28%$1.026
0.65%$59.63
-1.37%$0.072611
0.97%$0.999782
0.00%$0.01409308
-2.89%$548.12
4.08%$9.80
-0.12%$55.74
0.64%$0.18519
1.22%$0.168673
5.81%$331.47
-0.98%$8.27
0.09%$0.126833
-5.69%$219.15
-1.31%$0.999201
0.05%$1.48
-1.59%$0.999777
0.01%$45.48
1.43%$1.002
-0.18%$1.13
0.00%$0.740364
0.27%$0.999835
0.02%$0.066069
-0.41%$0.061137
4.07%$6.62
2.58%$1.00
0.00%$1.93
-1.64%$0.00000417
1.49%$4,005.35
0.74%$3.57
1.40%$1.14
0.48%$194.29
2.15%$0.379209
3.40%$0.057183
-0.42%$4,005.05
0.86%$81.13
0.53%$35.74
3.48%$0.622245
0.49%$1.26
3.97%$0.00000182
0.97%$1.00
0.01%$0.999217
0.02%$0.848748
-0.64%$0.995501
0.02%$0.423887
-3.79%$0.059839
-1.75%$0.386249
1.14%$89.42
-1.18%$0.99861
0.03%$1.96
-4.19%$2.16
1.64%$0.00000274
0.76%$1.64
0.68%$7.03
2.03%$0.999949
0.03%$0.999903
0.00%$1.21
0.03%$106.19
0.00%$64.97
2.14%$0.083303
8.66%$6.61
-1.07%$0.082605
0.90%$0.03543166
-9.79%$1.11
0.01%$1.15
0.04%$6.54
-6.97%$0.097559
0.59%$0.082738
3.29%$1.51
0.22%$0.02795176
-0.55%$1.48
0.03%$11.15
0.01%$0.754455
1.41%$2.41
-6.35%$0.083098
1.36%$6.68
1.08%$0.697104
-3.39%$1.041
-0.00%$0.085026
-3.77%$0.197839
2.41%$0.00163567
0.76%$0.765031
-0.24%$0.998823
0.07%$0.090884
2.73%$2.30
3.80%$0.00651872
-0.56%$0.999907
0.01%$0.02781961
0.77%$0.99872
0.01%$11.49
6.95%$0.62096
3.24%$0.999951
-0.01%$5.18
6.85%$0.997069
-0.03%$0.01225542
-0.60%$0.476466
0.37%$0.02756086
-6.76%$1.00
-0.01%$1.40
1.04%$34.16
3.04%$1.14
0.01%$0.436027
4.13%$0.639049
3.60%$0.0075044
-8.74%$1.049
0.03%$115.92
0.01%$0.00471223
0.29%$0.04952243
-1.98%$1.63
5.62%$0.00598845
-1.47%$0.159938
1.89%$0.01817863
1.04%$0.369649
-3.10%$0.997089
-0.00%$0.360631
3.65%$0.215511
1.63%$0.00005854
0.45%$0.04690565
-0.27%$130.96
2.56%$0.372
1.73%$0.165627
0.96%$0.843041
-1.26%$111.74
-2.39%$0.794296
-2.02%$0.55891
0.01%$18.63
1.08%$0.00000311
-7.55%$0.113585
-6.76%$0.0397616
0.56%$13.36
2.02%$0.00000027
-0.15%$0.00000027
0.67%$1.54
-0.19%$0.02186607
0.66%$0.222482
1.86%$0.04640194
4.00%$0.98764
-0.24%$0.070685
0.74%$1.12
0.01%$0.361457
-1.56%$0.00073607
0.00%$0.09027
9.77%$0.06504
-1.13%$0.00455643
5.00%$0.086085
-0.06%$0.097374
-0.03%$0.515508
-1.19%$12.36
-6.37%$63.85
0.54%$0.18193
1.27%$56.23
2.48%$0.00002154
-0.08%$29.71
-2.58%$0.999669
0.08%$0.849581
0.80%$0.998663
-0.09%$1.00
0.00%$0.00000096
0.47%$2,366.07
-0.83%$0.999715
-0.00%$0.198727
-1.00%$0.00200301
-5.46%$0.03296413
-1.50%$1.00
0.00%$0.02764034
-2.16%$4.54
6.32%$0.998023
-0.05%$0.062169
-3.13%$0.01705728
-0.20%$0.675944
1.21%$2.10
1.32%$0.00189454
-4.59%$0.653181
-0.80%$0.237527
4.63%$1.10
0.00%$0.01589756
-4.24%$0.03631599
2.68%$17.00
-1.41%$0.943507
-3.24%$1.00
0.00%$1.09
0.01%$1.09
0.07%$0.994374
0.03%$0.540234
-2.08%$0.155368
3.43%$0.01546342
0.61%$0.00000767
16.31%$1.66
0.16%$0.155048
2.87%$0.428878
4.57%$9.78
-0.63%$0.925439
-8.23%$0.998109
-0.05%$1.17
-1.65%$1,863.94
-0.09%$1.14
-0.02%$0.146981
-2.25%$0.42778
2.20%$1.014
0.04%$0.344716
-1.44%$0.143158
-1.83%$0.07286
1.34%$0.00362381
-0.17%$1.94
0.42%$91.02
0.16%$0.134498
1.28%$1.00
0.00%$0.133177
-0.44%$0.228375
1.47%$0.059615
-0.82%$0.0344996
1.85%$0.99945
0.01%$0.0477541
0.40%$1.92
-0.33%$0.130282
-0.02%$13.05
0.02%$0.123379
-5.88%$0.060193
1.53%$0.240326
1.06%$0.079753
0.23%$0.471728
-3.25%$1.019
-0.00%$0.263346
-11.36%$0.999142
0.43%$1,105.06
0.02%$0.069433
-2.55%$0.114936
0.66%$0.284089
0.04%$1.00
0.00%$0.269234
1.46%$3.20
0.00%$1.21
-1.31%$0.998782
0.06%$0.11084
-1.86%$2.35
-0.10%$1.00
0.00%$0.32406
-1.23%$0.067097
-1.70%$0.999872
0.05%$0.055653
0.85%$0.12821
-2.01%
Bitcoin’s status as a safe haven was threatened recently when its price fell in line with the global stock market. Suddenly it was perceived as a more risky asset—with investors seeking safety in stablecoins, and cash.
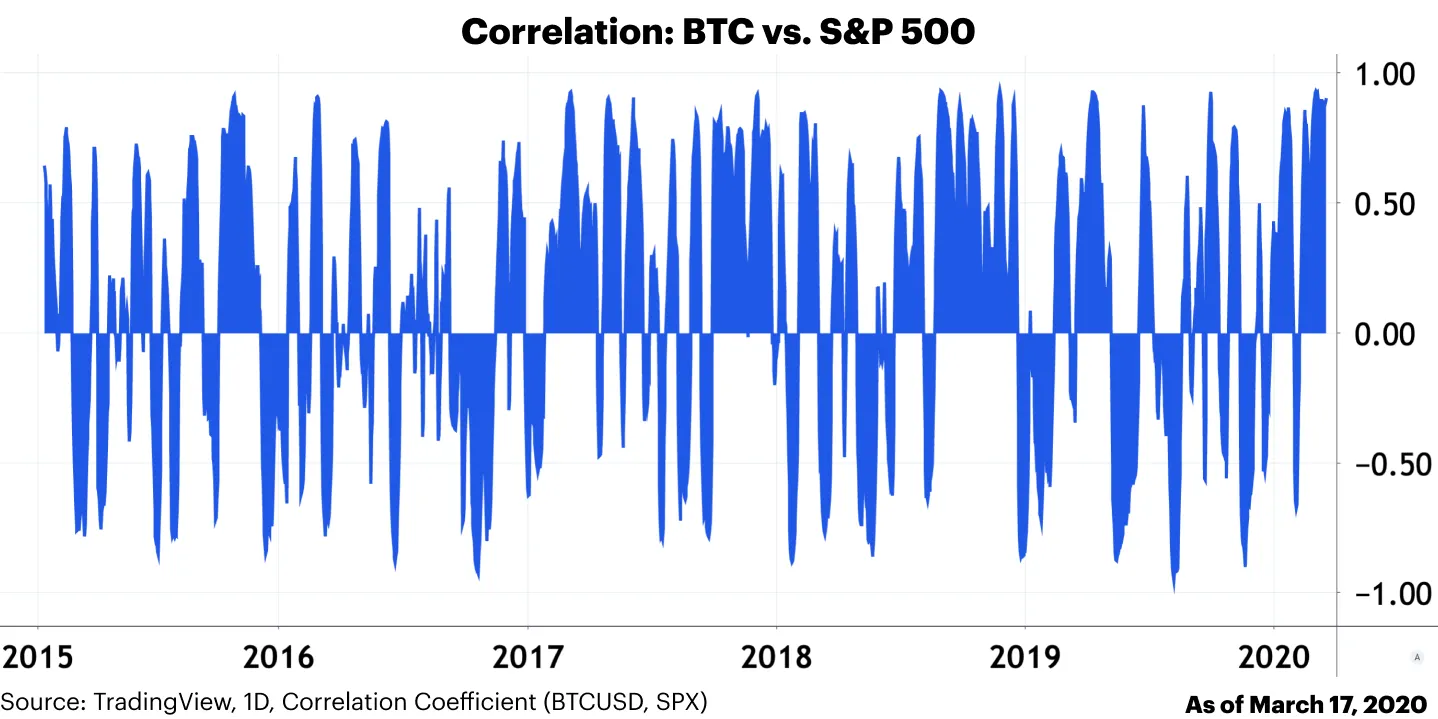
But a report by crypto exchange Coinbase published yesterday begs to differ. While it acknowledges that Bitcoin does sometimes correlate with traditional markets, it often goes completely the other way.
A value of 1 indicates a perfect positive correlation, while -1 indicates a perfect negative correlation.
“Bitcoin’s historical correlation with the S&P 500 swings wildly between 1.00 and -1.00, seemingly positively correlated at times then negatively correlated during others. That means BTC has been largely uncorrelated with major stock market indices throughout its history.”
To compare, Coinbase found that the S&P 500 was almost always correlated with the Dow Jones Industrial Average, while Bitcoin was highly correlated with Ethereum.
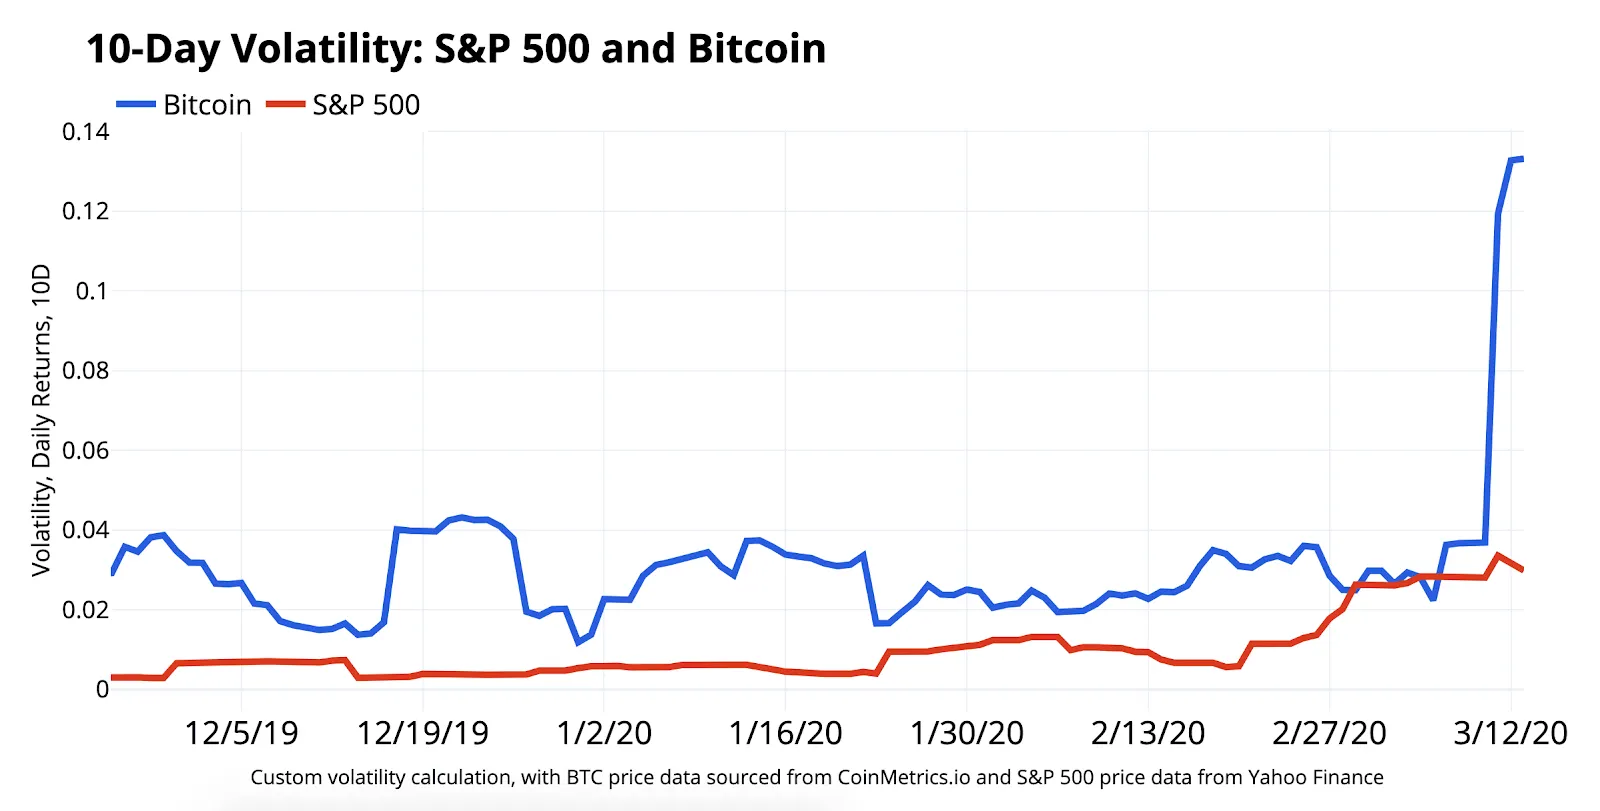
But there’s one thing they do have in common right now and that’s increased volatility. “By measuring 10-day volatility, the S&P 500 has recently spiked to levels that rival Bitcoin’s typical range. S&P 500 volatility has increased substantially in recent days, and so has BTC," the report stated.
But then, with the stock markets experiencing their worst day in 30 years and Bitcoin the worst day in seven years, that’s not exactly a surprise.