Disclaimer
The views and opinions expressed by the author are for informational purposes only and do not constitute financial, investment, or other advice.
$95,890.00
-1.11%$3,304.21
-1.11%$2.24
1.00%$655.02
0.05%$181.18
0.47%$0.315968
-0.13%$1.00
0.07%$3,297.54
-1.09%$0.89093
-0.30%$0.246392
1.44%$36.94
-1.19%$22.17
0.25%$3,934.63
-1.19%$5.39
2.60%$95,613.00
-1.38%$4.36
-0.85%$0.0000216
-0.49%$0.358856
1.43%$6.91
0.31%$0.263361
4.59%$29.08
-5.49%$3,302.68
-1.37%$450.04
-0.16%$9.32
0.42%$13.93
5.17%$100.46
0.92%$0.00001781
3.78%$3,486.34
-1.10%$5.05
1.45%$0.998786
-0.09%$4.15
0.30%$0.998731
0.04%$9.29
-0.63%$9.98
-0.23%$307.96
2.68%$0.156601
-0.13%$0.478116
2.26%$1.17
0.88%$26.03
0.57%$0.04595446
1.94%$7.05
0.32%$3.75
2.11%$191.99
3.33%$24.46
0.41%$454.23
0.23%$1.26
1.19%$0.746393
1.08%$1.069
1.79%$0.118549
-0.16%$4.87
-0.56%$0.347066
5.31%$0.986751
1.10%$44.98
0.65%$6.47
-0.19%$1.65
-0.18%$0.00003153
5.49%$1.77
1.21%$1.63
-2.78%$2.31
-12.03%$4.94
1.73%$1.31
-1.12%$2.16
2.70%$95,965.00
-1.07%$3,299.05
-1.22%$20.43
0.68%$0.206631
1.21%$1.93
0.81%$0.832962
-14.38%$0.423165
1.41%$2.21
1.98%$3,715.59
-0.76%$0.996802
0.11%$4.97
0.31%$3,410.07
-1.29%$0.02637987
-9.78%$12.98
0.17%$0.00016846
1.01%$0.03295443
1.37%$19.73
-1.30%$1.73
3.36%$105.70
-1.66%$3,476.67
-1.06%$0.03520252
0.46%$95,696.00
-1.59%$0.02616973
-3.57%$0.02731445
2.56%$1.001
0.13%$3.33
0.87%$1,587.72
-1.53%$0.562615
0.83%$11.16
0.45%$1.33
0.21%$0.361641
0.17%$1.26
0.41%$95,685.00
-1.15%$0.219556
-0.24%$0.128026
2.27%$4.36
0.81%$3,399.65
-1.12%$0.788915
-0.29%$6.73
-0.08%$185.37
0.49%$34.18
-1.36%$0.718875
2.33%$0.81502
-0.09%$0.00000113
6.57%$0.072635
-2.35%$0.947902
3.60%$1.49
-4.84%$0.474791
1.27%$53.43
1.43%$16.02
2.42%$0.294321
2.24%$0.820665
3.96%$1.43
1.05%$226.39
1.00%$1.076
-5.64%$14.11
2.00%$6.01
-1.58%$33.49
-0.70%$0.478413
2.29%$95,394.00
-0.70%$57.01
5.73%$0.474318
2.10%$95,426.00
-1.10%$3,301.46
-1.03%$0.00000213
6.52%$1.14
1.83%$4.99
-0.40%$2.98
2.62%$3.12
-0.75%$0.084501
1.29%$3.64
-1.61%$0.770122
8.39%$0.997912
0.09%$3,307.66
-1.01%$0.745946
-10.31%$0.733389
20.65%$0.153907
-0.53%$0.26006
-0.15%$0.599149
1.41%$3,306.59
-1.02%$0.00703121
5.73%$192.25
-0.35%$0.00003569
4.90%$0.638948
-3.06%$79.19
-0.57%$1.86
-1.29%$2.34
0.25%$261.50
-0.77%$1.49
-1.82%$1.98
0.74%$20.97
3.30%$95,352.00
-1.37%$0.747323
2.05%$0.00776261
1.04%$0.315102
-0.71%$2,635.47
0.23%$0.994029
-0.12%$1.43
0.93%$0.00628393
1.82%$0.172532
0.74%$2.58
4.98%$0.663278
-11.02%$3,478.69
-1.02%$0.00010793
0.13%$5.32
-2.77%$0.01091953
0.68%$0.00850994
3.75%$3,581.81
-0.99%$15.86
17.30%$10.04
4.64%$0.00
0.33%$1.019
-0.04%$26.81
4.22%$0.00627694
3.69%$0.56227
-6.66%$3,304.69
-1.11%$17.86
-4.28%$1.063
-1.13%$1.30
6.72%$0.077368
-0.70%$0.2553
0.75%$0.079157
-0.64%$0.999287
-0.03%$0.379192
0.59%$10.28
-1.08%$2,616.34
0.00%$96,073.00
-0.79%$0.00000052
0.39%$94,945.00
-1.47%$1.067
-6.76%$0.999449
-0.10%$3,316.43
-0.43%$1.19
-4.40%$0.492486
2.67%$30.60
0.06%$0.01063334
1.66%$1.45
1.16%$3,309.86
-0.96%$30.13
18.53%$0.0485514
3.88%$4.66
0.19%$0.425875
1.61%$1.071
0.13%$0.00601942
-0.22%$0.060147
2.15%$95,584.00
-1.21%$0.065411
3.12%$35.84
0.49%$3,549.63
-1.34%$3,443.60
-1.07%$0.006215
2.37%$0.264532
-6.90%$0.00544395
-0.03%$0.00099771
5.37%$0.0023409
-1.36%$5.24
0.87%$1.95
-0.96%$0.998484
0.52%$1.08
-0.01%$0.02090685
2.38%$3.05
-4.32%$87.58
-1.73%$1.001
0.15%$0.454189
1.39%$0.215799
-0.54%$0.067484
-2.40%$0.203428
0.69%$0.03824794
2.74%$0.00000303
-1.62%$3,650.17
-0.97%$0.00000018
2.74%$2.93
6.05%$0.999075
-0.25%$0.656106
1.09%$0.865984
-0.34%$0.353282
2.84%$0.0351161
1.89%$0.133095
1.16%$3,318.76
-0.72%$0.01030791
1.77%$0.03642889
1.34%$3,485.33
-1.33%$2.22
-4.62%$1,922.01
-1.30%$3.17
-2.74%$43.72
-0.65%The U.S. Bureau of Labor and Statistics today reported a 5% rise since last year in the consumer price index, reviving inflation fears.
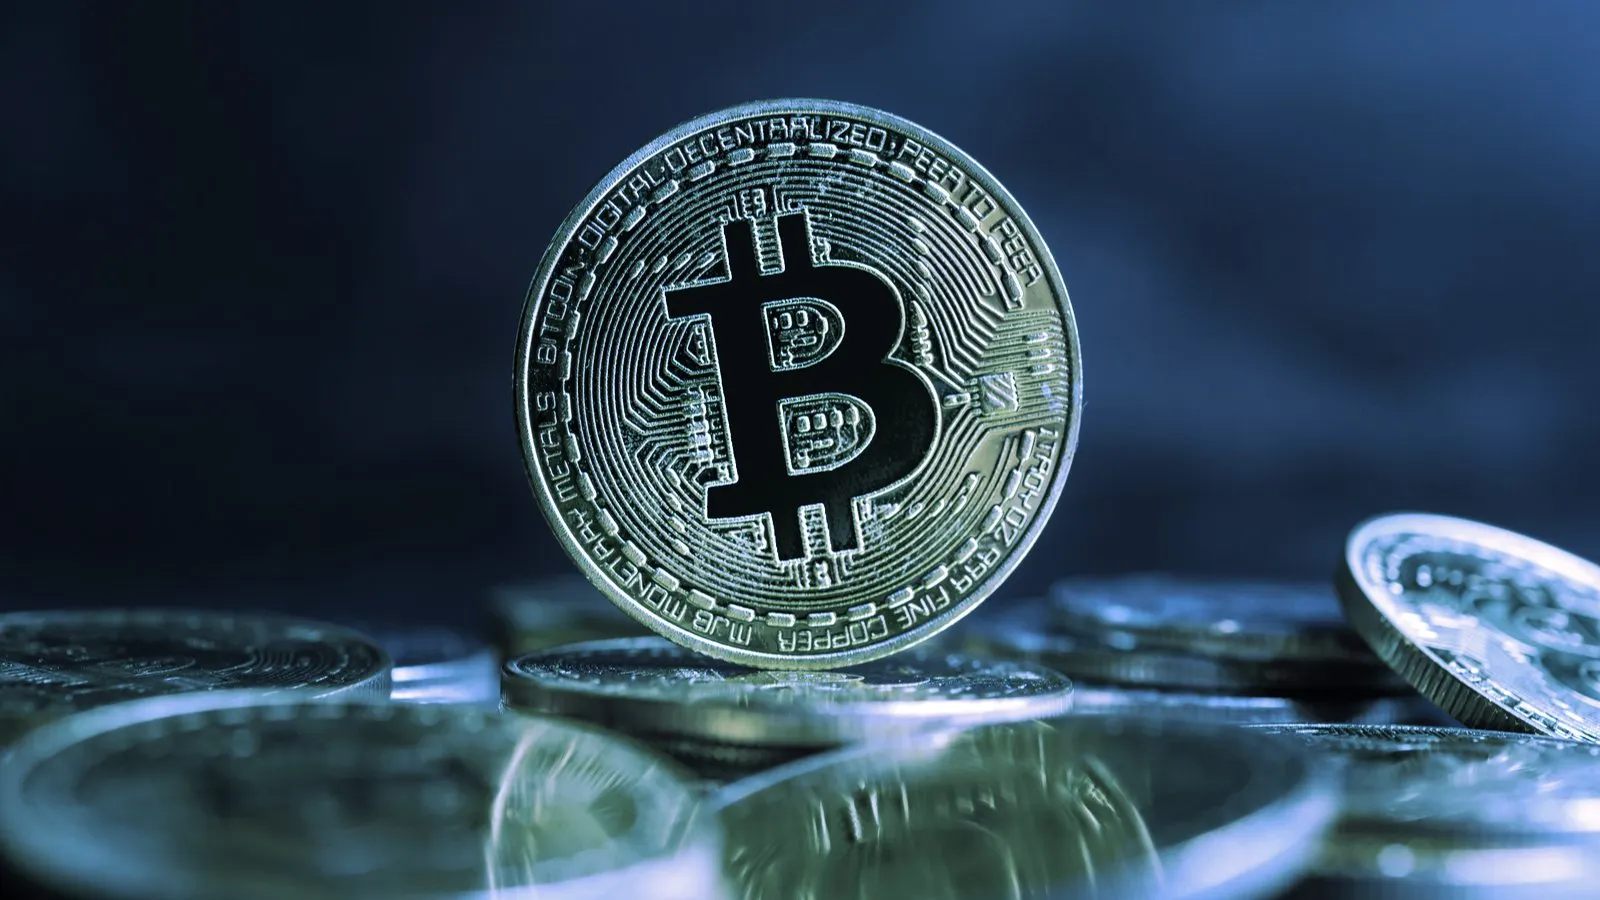
This is the fastest year-over-year rise since the housing bubble burst in 2008. At that time, the index rose 5.3%. Bitcoin, often heralded as a hedge against inflation, is up 6.6% over the past 24 hours.
The consumer price index (CPI) is a basket of consumer goods used to measure individuals' general cost of living. Items range from the cost of milk, cereal, and bacon to used cars, sports equipment, and housing. Economists use changes in the CPI as one metric for determining if an economy is experiencing inflation or deflation.
Of the 80,000 total items included in the index, the average change in cost rose by 5%, indicating that many consumer goods have become more expensive. A standout category among those items was the price of used cars and airfare, both rising 7.3% and 7%, respectively.
These figures are much higher than expected.
Two forces are driving these raises: Consumer spending outpacing supply and a record-breaking period of fiscal stimulus. The pandemic pinched many supply chains last year, creating a demand squeeze for various materials like lumber.
The side effects of the pandemic are still playing out, which may be a key reason behind Thursday's unusual CPI report. "Supply shortages are hitting numerous industries," an analyst at Quantum Economics, Alexandre Lores, told Decrypt. "Microchips being a serious example. Ketchup packets being another. These last two points can make big waves."
As for the latest fiscal policy, Lores said that stimulus isn't "always bad." But over time, "one can irresponsibly ignore basic laws of economics, and it always results in a crash."
The S&P 500, an equity index of the 500 largest U.S. companies, is up 0.21% following the report and is now trading at an all-time high.
Disclaimer
The views and opinions expressed by the author are for informational purposes only and do not constitute financial, investment, or other advice.