Disclaimer
The views and opinions expressed by the author are for informational purposes only and do not constitute financial, investment, or other advice.
$67,653.00
1.23%$1,965.07
1.04%$1.42
0.88%$624.99
3.00%$0.999885
-0.00%$84.23
2.46%$0.285231
0.23%$0.099901
1.92%$1.031
0.75%$557.69
-0.56%$50.56
0.67%$0.283607
4.21%$0.999821
-0.01%$8.69
0.15%$29.98
2.99%$8.96
5.15%$0.999194
0.05%$333.84
-0.45%$0.162785
3.12%$0.161504
1.27%$0.999189
-0.03%$0.00960953
-1.54%$259.31
-1.48%$0.099718
1.90%$55.13
4.80%$0.999528
-0.04%$9.13
2.69%$0.00000638
3.06%$0.950392
3.38%$1.34
-1.98%$0.078267
0.23%$0.118584
1.96%$5,088.03
2.20%$5,117.78
2.27%$1.34
-0.89%$1.33
4.05%$3.45
2.93%$0.624334
0.76%$1.00
0.00%$117.18
-4.98%$0.00000422
-0.11%$0.721673
0.77%$0.997063
-0.01%$178.97
0.44%$79.31
0.02%$2.34
0.65%$0.999989
0.02%$0.175951
1.87%$1.12
0.00%$0.999922
0.01%$0.0000017
0.09%$0.064279
0.06%$1.047
4.73%$8.66
4.95%$0.998588
-0.02%$0.266511
2.60%$0.00209609
1.43%$11.00
0.01%$2.20
2.40%$2.35
2.84%$7.14
1.06%$0.105254
0.98%$8.42
1.24%$0.387463
4.45%$0.0189053
6.07%$0.06034
-2.56%$66.59
-0.27%$0.1102
-0.71%$1.61
14.74%$0.870176
1.51%$0.03111451
3.04%$0.999366
0.06%$3.55
4.19%$0.090304
1.81%$0.00933227
0.72%$1.23
0.16%$1.49
7.12%$0.999597
0.01%$1.027
0.01%$0.951172
4.43%$114.37
0.02%$1.11
0.13%$0.03501
0.96%$0.876729
2.08%$0.00775582
1.06%$0.080175
-0.06%$1.095
0.01%$0.998569
0.08%$0.096149
-1.64%$0.00000636
4.00%$0.03024683
2.41%$0.999478
-0.04%$0.15948
5.83%$0.0129416
0.03%$0.99894
0.08%$0.26847
10.34%$0.999732
-0.02%$0.071272
2.19%$0.478687
-1.62%$1.087
-0.05%$1.18
0.17%$0.25471
2.29%$34.91
0.90%$0.00687436
4.52%$1.29
3.37%$0.648782
3.16%$0.390847
2.87%$24.31
7.09%$0.998884
0.03%$1.12
1.46%$161.44
-0.06%$0.0434398
3.20%$0.167497
3.87%$1.49
0.83%$0.03560824
-6.88%$0.245632
2.86%$0.083142
1.44%$0.468829
2.87%$0.999604
-0.02%$3.38
3.23%$0.00000034
1.21%$0.00000034
-2.27%$1.64
11.21%$0.05628
1.11%$0.01695507
-2.29%$16.14
-0.05%$1.02
0.02%$117.27
1.56%$0.053533
2.46%$3.14
1.14%$0.070849
4.08%$0.323619
0.10%$0.162643
-3.41%$0.0000305
2.27%$0.330557
4.19%$0.02707517
3.09%$0.998144
0.08%$0.311159
0.04%$0.00576416
2.95%$0.329061
2.39%$0.99183
0.01%$17.41
0.03%$1.46
5.70%$0.127293
-7.72%$0.051919
2.47%$0.226494
-0.96%$0.075403
8.01%$0.0027287
2.23%$1.59
1.23%$6.59
2.27%$0.04583759
3.08%$0.02006039
1.02%$0.00249306
-1.21%$0.999517
0.04%$0.02089872
1.91%$0.08418
3.01%$0.224261
3.49%$5,877.69
-2.55%$0.529526
2.04%$1.29
2.74%$1.075
0.02%$0.999993
-0.00%$0.988162
-0.00%$1.00
0.01%$0.00213852
2.17%$22.86
0.00%$0.00003721
0.05%$0.094315
0.26%$0.00000096
0.88%$1.21
2.54%$0.198428
3.64%$1.04
17.11%$2.76
3.17%$4.37
21.62%$0.053402
1.91%$0.194893
0.33%$1.00
0.00%$0.00510168
0.47%$0.097798
2.36%$1.52
2.38%$0.18564
2.33%$0.00391396
3.90%$0.078944
-0.65%$2.00
0.80%$0.121161
1.30%$2.24
4.70%$1.00
0.00%$18.20
1.61%$0.651314
2.72%$0.999817
-0.01%$0.762627
0.29%$0.168715
0.79%$0.053469
0.85%$1.80
-0.15%$0.222755
3.50%$0.0434248
1.66%$0.02261579
9.09%$8.28
-0.79%$2.10
-0.66%$47.98
-0.00%$0.99541
0.17%$0.00000793
1.24%$1.27
-1.03%$0.998219
0.01%$1.013
0.03%$13.72
-7.36%$0.151631
2.07%$0.998435
-0.06%$0.33338
0.59%$1.001
2.28%$0.414059
4.67%$0.312398
0.51%$0.164263
4.82%$0.656087
8.24%$0.277664
0.70%$0.314352
11.32%$9.00
0.09%$0.566772
15.32%$4.58
2.10%$0.01635714
16.62%$0.327575
-1.38%$0.081438
1.66%$2.01
4.06%$0.093241
1.67%$0.130873
-2.60%$1,097.13
-0.03%$0.080722
2.86%$0.381033
9.97%$0.074524
2.89%$1.68
-8.77%$0.129605
6.89%$0.257534
0.01%$0.59253
2.79%$0.0015066
0.45%$0.995105
0.02%$0.00410079
-1.07%$0.130732
-0.11%$0.359858
-1.67%$0.120255
2.47%$0.995734
-0.53%$0.00229398
2.80%$0.196499
2.23%$0.02061777
6.46%$2.35
1.71%$0.206944
6.19%$0.059783
-8.54%$0.999664
-0.02%$0.999937
0.01%
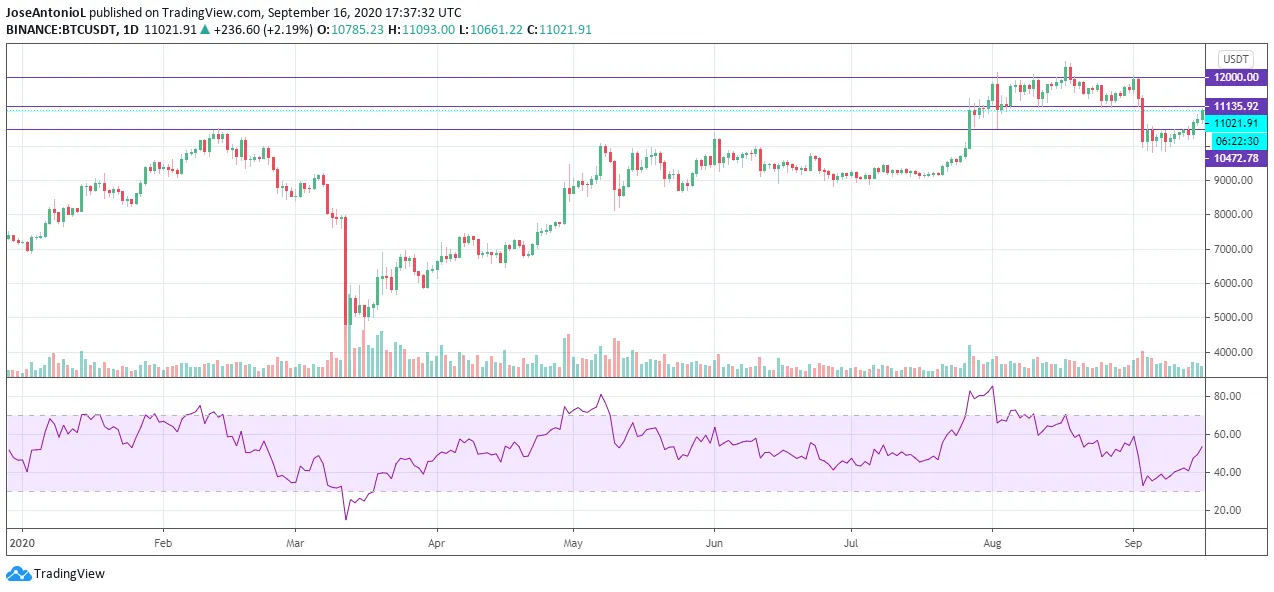
At the beginning of the month, the price of Bitcoin took a beating. It sank from nearly $12,000 per coin all the way down to $10,000 over the course of just two days.
Today, Bitcoin seems to have finally recovered from that crash, trading above $11,000 per coin for the first time since then—even if briefly.
At the moment, Bitcoin is trading for just below $11,000, having corrected slightly since hitting that mark.
This would be the third day in a row that Bitcoin shows bullish signs since the crash. It’s been steady growth for the coin since a slight dip to $10,300 on Sunday.

And the markets are reasonably healthy, too. Bitcoin’s relative strength index, a metric that estimates the equilibrium of buyers and sellers in a market, shows a near-perfect balance at the moment. In other words, neither Bitcoin bulls nor Bitcoin bears are dominating the market at this time.
This is, in general, positive news for holders. The absence of excessive FUD or FOMO sentiment is a sign that the markets aren't particularly nervous, and there’s no reason to suspect any aberrant overreaction from traders. Then again, this is crypto, and the market doesn’t always behave rationally.
Bitcoin has recently passed the baton of sudden price movements and lambo dreams to the burgeoning field of so-called DeFi tokens. These are coins that are used in decentralized finance protocols, such as for lending products.
Now, those who trade coins such as YAM, YFI, SUSHI, and even Chainlink are the ones feeling the thrill of historical highs and lows within hours, while Bitcoin hodlers watch the market from the sidelines and settle for single-digit variations within short periods.
Disclaimer
The views and opinions expressed by the author are for informational purposes only and do not constitute financial, investment, or other advice.
